
ICEUPWRT · ICE U.S. Electricity Futures Index
Monthly Update — Plain-Language Summary As of September 30, 2026
Electricity prices jumped in September as a late-season heat wave hit the Midwest and mid-Atlantic while many power plants were offline for routine autumn maintenance, and the ICEUPWRT index — a measure of power prices across six regional markets — rose about 9.9% for the month, its best month in nearly four years, while broad commodities were roughly flat. The gains came mainly from the PJM (mid-Atlantic/Midwest) and MISO (central U.S.) markets. The bigger picture is unchanged: electricity is a growing, demand-driven market — powered by data centers and AI — that increasingly moves on its own path, apart from oil, metals and crops.
▪ The index rose about 9.9% in September while broad commodity markets were roughly flat (up 0.6%) — a reminder that power often moves on its own.
▪ Late heat met maintenance season: with many power plants offline for autumn repairs, a mid-September heat wave pushed grid operators into emergency alerts and sent prices sharply higher for a few afternoons.
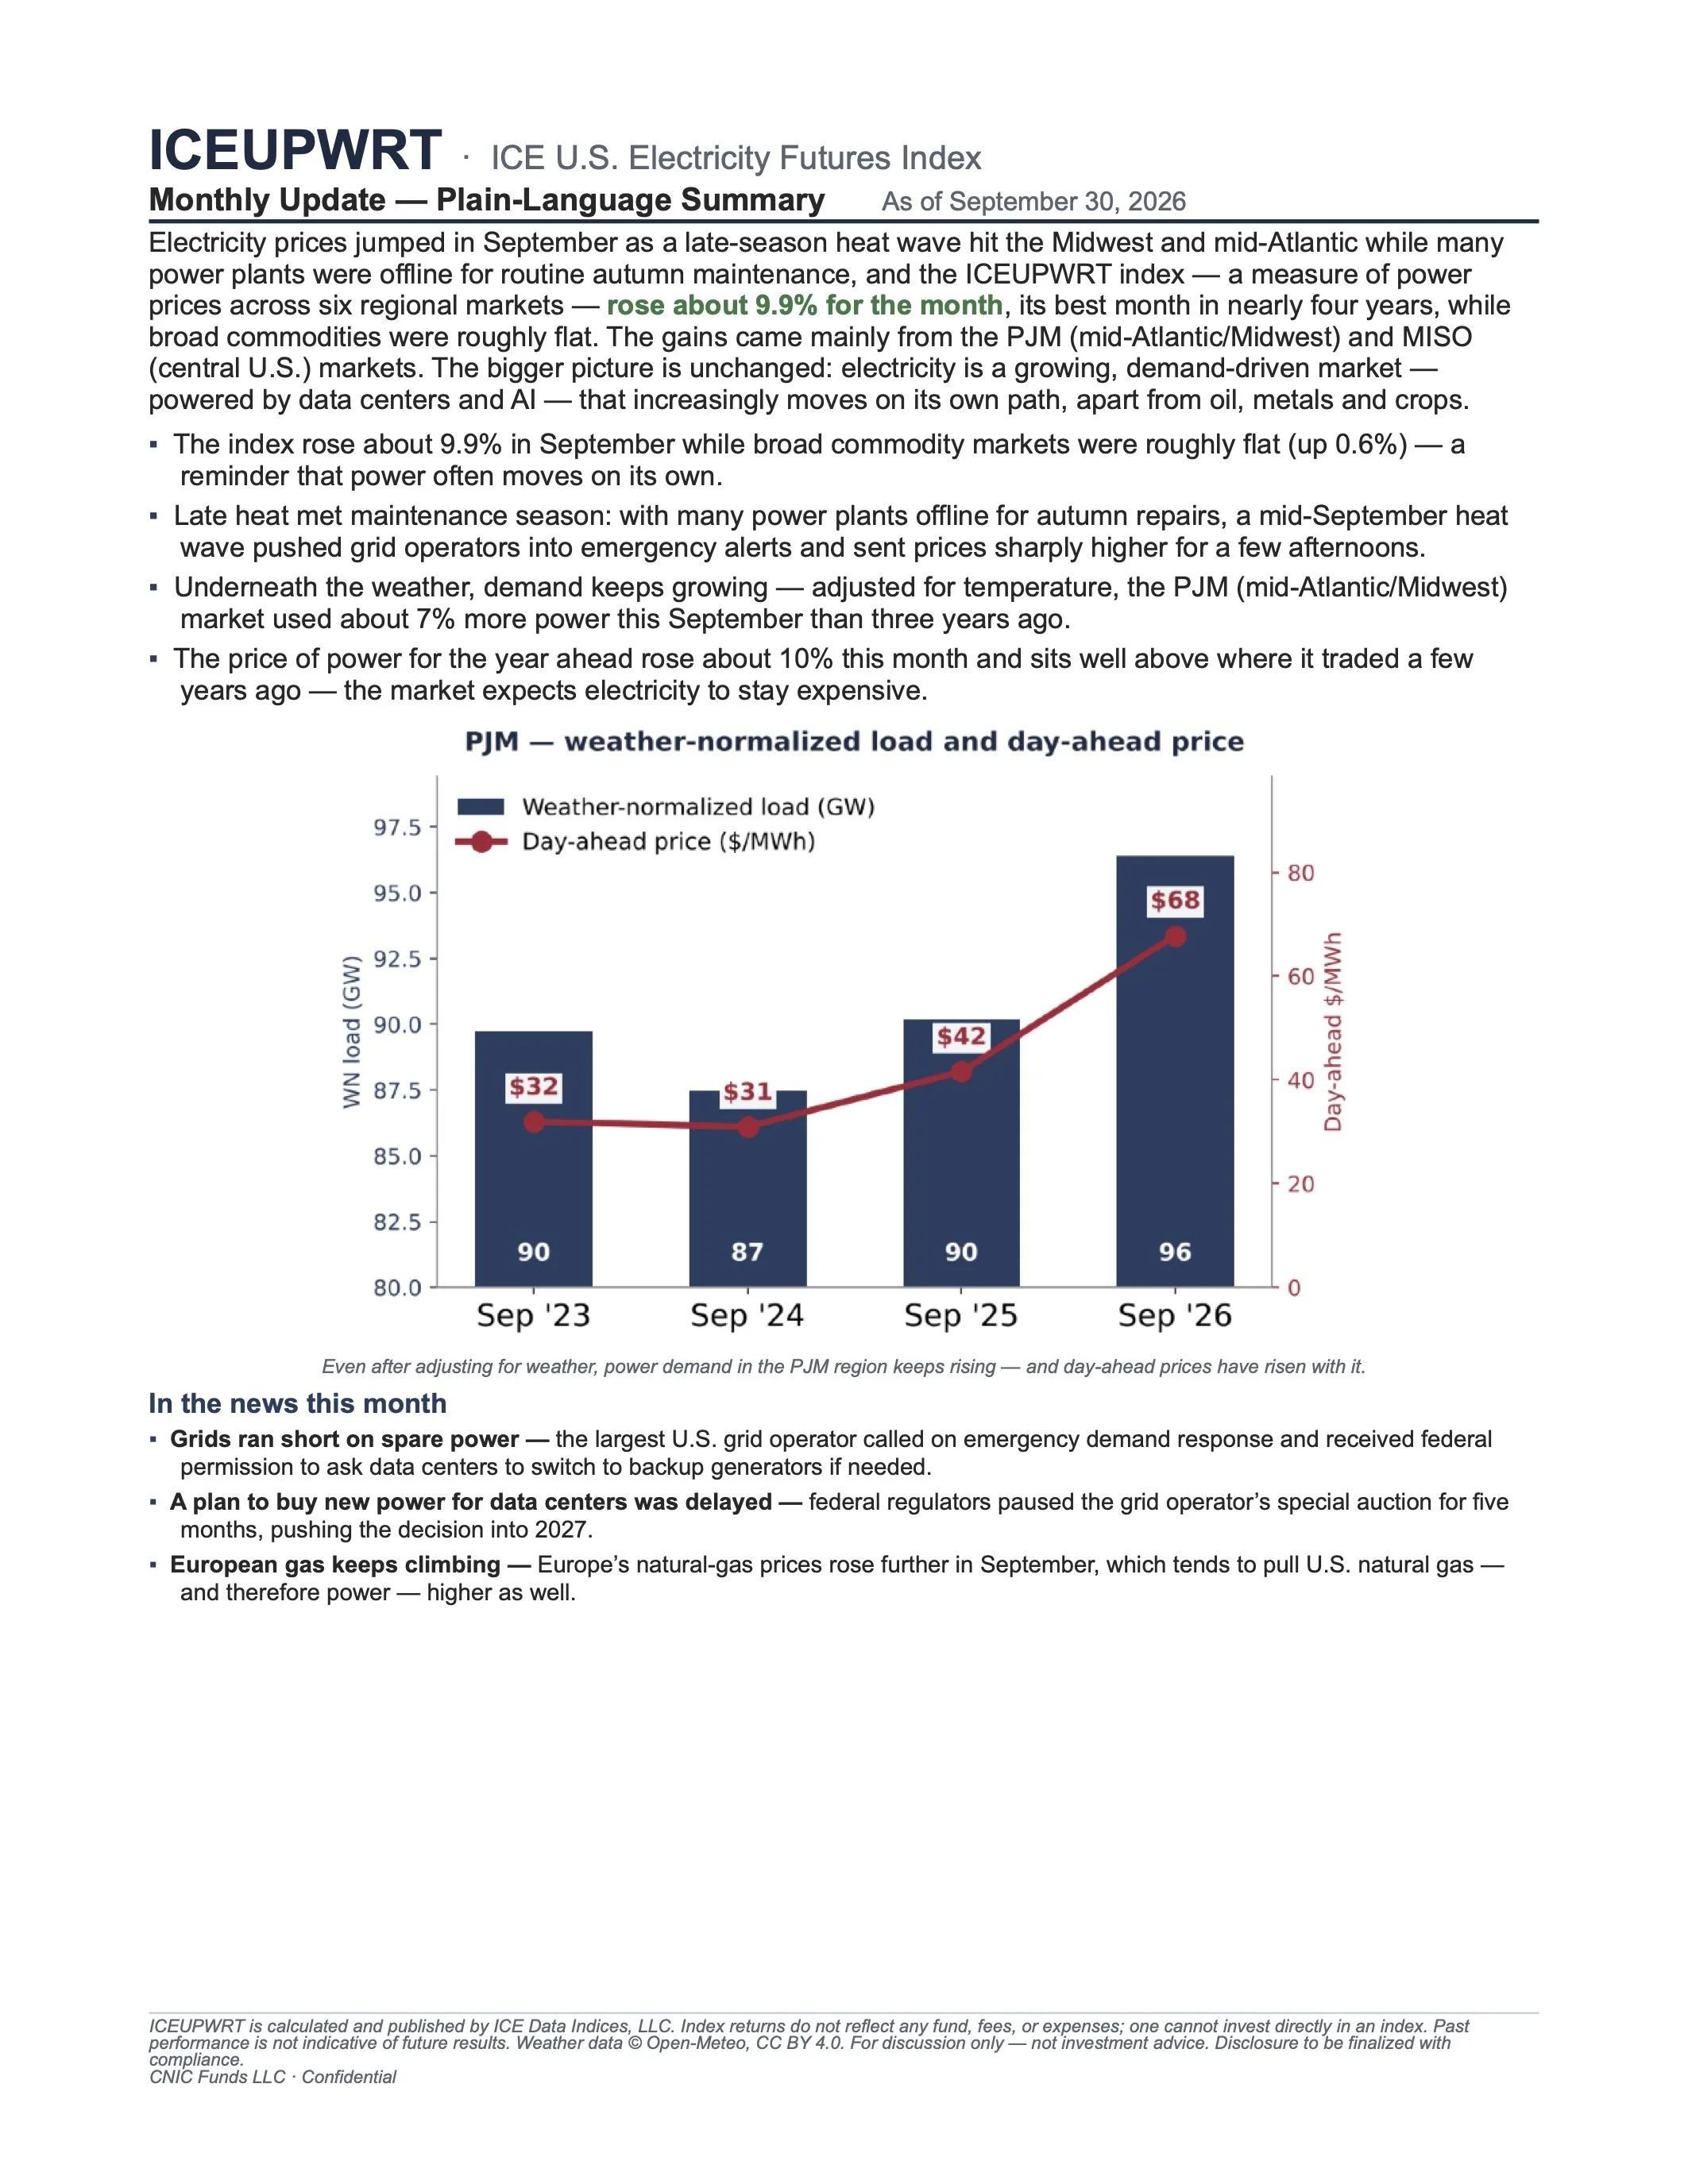
▪ Underneath the weather, demand keeps growing — adjusted for temperature, the PJM (mid-Atlantic/Midwest) market used about 7% more power this September than three years ago.
▪ The price of power for the year ahead rose about 10% this month and sits well above where it traded a few years ago — the market expects electricity to stay expensive.
Even after adjusting for weather, power demand in the PJM region keeps rising — and day-ahead prices have risen with it.
In the news this month
▪ Grids ran short on spare power — the largest U.S. grid operator called on emergency demand response and received federal permission to ask data centers to switch to backup generators if needed.
▪ A plan to buy new power for data centers was delayed — federal regulators paused the grid operator’s special auction for five months, pushing the decision into 2027.
▪ European gas keeps climbing — Europe’s natural-gas prices rose further in September, which tends to pull U.S. natural gas — and therefore power — higher as well.
ICEUPWRT is calculated and published by ICE Data Indices, LLC. Index returns do not reflect any fund, fees, or expenses; one cannot invest directly in an index. Past performance is not indicative of future results. Weather data © Open-Meteo, CC BY 4.0. For discussion only — not investment advice. Disclosure to be finalized with compliance.
CNIC Funds LLC · Confidential
What is the ICEUPWRT index?
The ICEUPWRT tracks the price of electricity traded for future delivery across six major U.S. regional power markets. It is a real, published index calculated by ICE Data Indices — not a hypothetical or back-tested model. Because electricity cannot be easily stored and demand is now growing quickly, power prices behave differently from most commodities, which is what makes the index a distinct building block for a portfolio.
Why it matters
American electricity demand is growing for the first time in a generation — led by data centers and artificial intelligence — while new supply is slow and expensive to build. Generating equipment is scarce and costs more, and projects face labor shortages and long delays. That combination, rising demand meeting slow-to-grow supply, tends to support power prices over time, and it has historically shown little relationship to broad commodities like oil and metals — the reason power can help diversify a portfolio.
A real track record since 2018
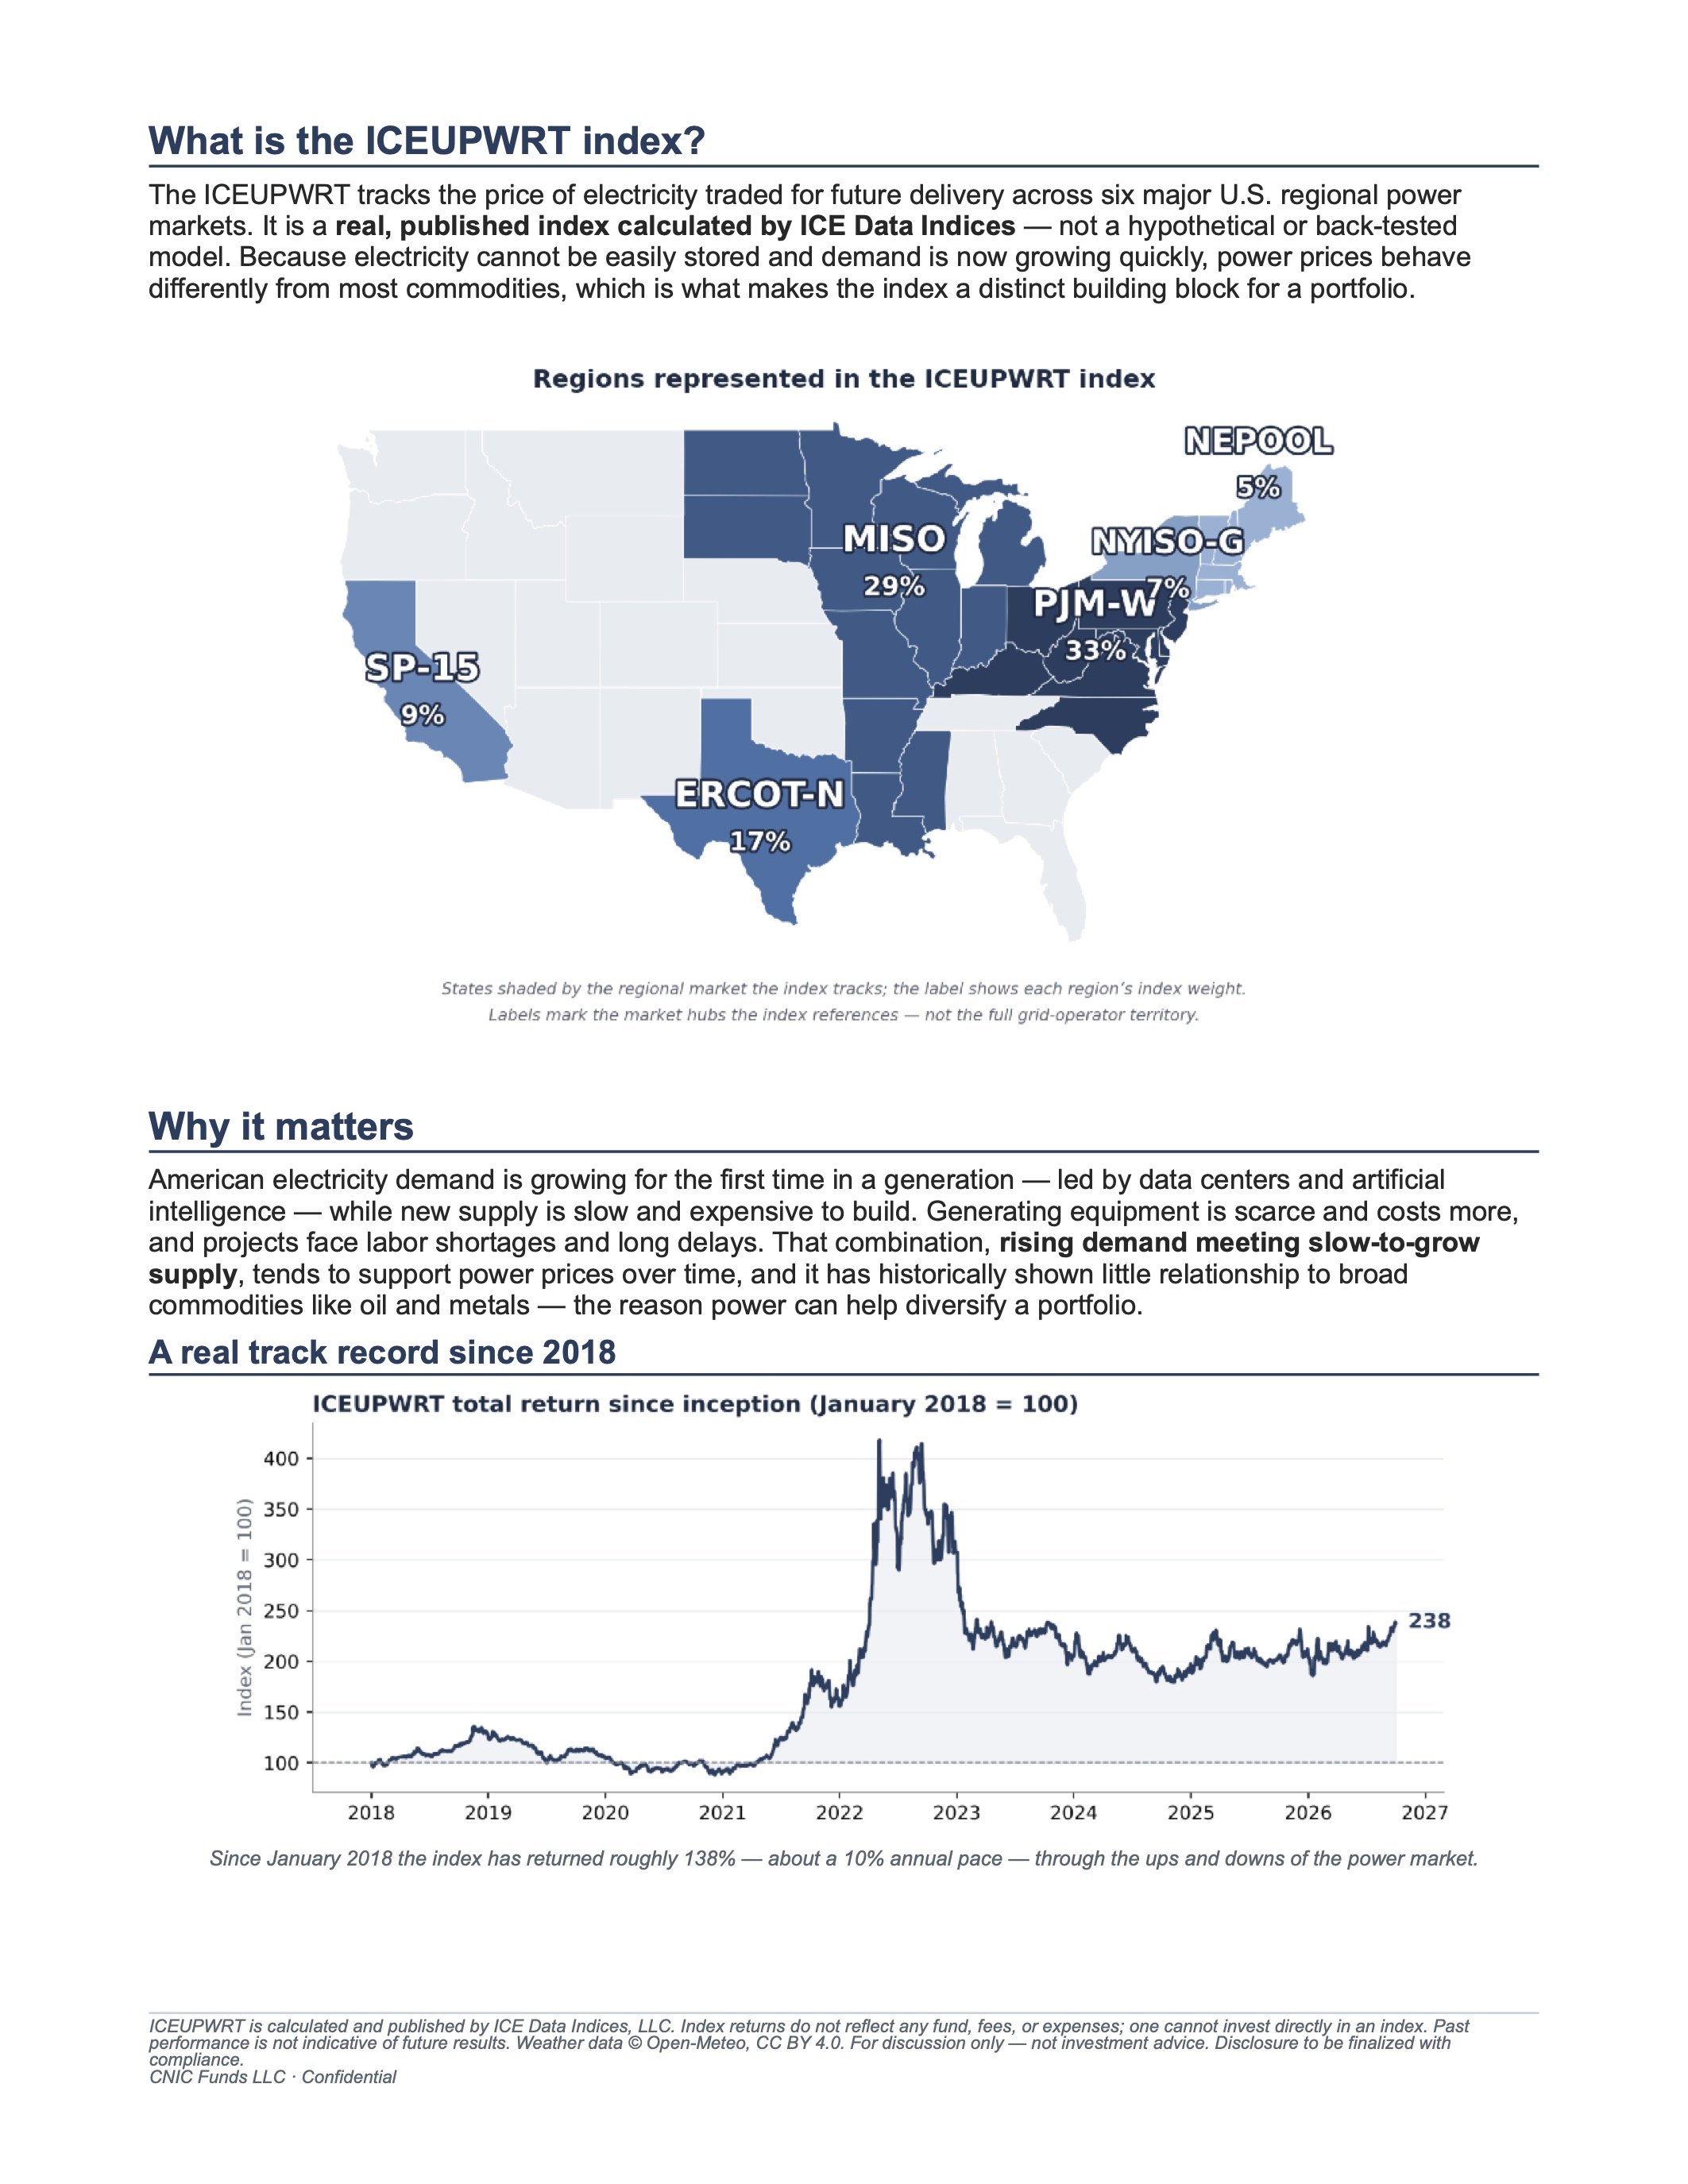
Since January 2018 the index has returned roughly 138% — about a 10% annual pace — through the ups and downs of the power market.
ICEUPWRT is calculated and published by ICE Data Indices, LLC. Index returns do not reflect any fund, fees, or expenses; one cannot invest directly in an index. Past performance is not indicative of future results. Weather data © Open-Meteo, CC BY 4.0. For discussion only — not investment advice. Disclosure to be finalized with compliance.
CNIC Funds LLC · Confidential
