

ICEUPWRT · ICE U.S. Electricity Futures Index Monthly Index Update
As of September 30, 2026 Index-level reporting · fund pending launch
September: ICEUPWRT +9.90% total return — the index’s best month since November 2022, well ahead of broad commodities (BCOM +0.61%) and in step with energy (BCOMEN +10.15%). The gain came from the two largest Individual ISOs — PJM-W and MISO added about 8.4 points of excess return between them as a mid-September heat wave arrived with much of the fleet out for autumn maintenance — and price (spot +9.44%), not carry, drove it. At constant weather PJM load is 7.4% above three Septembers ago, and the forward strip re-rated about 10% in a month to $71.5/MWh, led by next summer.
1 · Performance
MTD (Sep) —
Trailing 12M 17.47%
Spot = price appreciation (per ICE Data Indices, consistent with BCOM/BCOMEN spot); Roll = ICEUPWRE − ICEUPWRS; Collateral = ICEUPWRT −
ICEUPWRE. Components are additive in return space. Ann. Rtn = compound annualized; not shown for sub-annual periods.
BCOMEN — commodity energy 5.00%
BCOM September by sector: energy +10.1%, livestock +0.5%; industrial metals −1.6%, agriculture −5.8%, precious metals −6.8% — power’s gain ran with energy, not with the
broad complex.
2 · Individual ISO Attribution
Contribution to the index excess return, in index return points. Collateral is not ISO-specific, so it is added as a single line below to bridge to the total return shown in §1 (September +9.90%, YTD +14.88%).
ICEUPWRT
YTD 2026
Since Incpt1
Total Return
ICEUPWRT
BCOM — broad commodity
Individual ISO
PJM-W SP-15 NEPOOL
Reconstruction residual2
+ Collateral (3-mo T-bill)
12.81%
(0.69)%
0.06%
(1.40)%
3.14%
MISO
ERCOT-N
NYISO-G
Sum of ISOs
Index excess return
Index total return
Spot
9.44%
15.51%
19.08%
87.35%
Weight
33.48%
28.74%
9.48%
16.66%
5.05%
6.59%
MTD
9.90%
0.61%
10.15%
Roll
0.12%
(3.77)%
(5.98)%
(0.25)%
Excess Ret (Sep)
YTD
14.88%
32.87%
86.30%
12.88%
14.10%
11.57%
3.66%
(4.35)%
0.05%
13.14%
(3.35)%
Collat.
0.34%
3.14%
4.37%
50.93%
T12M
17.47%
40.64%
74.68%
Contrib. (Sep)
4.31%
4.05%
1.10%
0.61%
(0.22)%
(0.22)%
9.63%
(0.07)%
9.56%
0.34%
9.90%
Total Rtn
9.90%
14.88%
17.47%
138.03%
TR since Incpt1
138.03%
103.96%
53.27%
10.43%
Ann. Rtn
10.43%
Contrib. (YTD)
8.49%
14.88%
2 Individual-ISO returns are reconstructed from ICE forward strips (12-month, 1/12 per delivery month; roll over the first 15 business days of the expiry month, per index methodology) and reconciled to the actual ICEUPWRE; the residual line captures reconstruction tracking error. September (0.07)% sits well inside the disclosed ~1% single-month level; YTD (1.40)% is cumulative across nine months.
3 · Risk
1 Since inception 01-Jan-2018. Volatility and correlation are trailing-12M; Modified Sharpe is since inception. 3 Modified Sharpe = annualized return ÷ annualized daily-return volatility (no risk-free deduction). 4 Correlation of daily returns. ICEUPWRT is calculated and published by ICE Data Indices, LLC. Index returns do not reflect any fund, fees, or expenses; one cannot invest directly in an index. Past performance is not indicative of future results. Disclosure to be finalized with compliance.
Weather data (later sections): © Open-Meteo, CC BY 4.0. | CNIC Funds LLC · Confidential — for discussion
Ann. Rtn
6.47%
(5.55)%
—
11.74%
Risk
Realized volatility (ann.)
Correlation to ICEUPWRT4
ICEUPWRT
19.82%
0.51
—
BCOM
15.37%
0.67
0.40
BCOMEN
35.61%
0.55
Modified Sharpe (since incep.)3 0.18
1 Since inception 01-Jan-2018. Volatility and correlation are trailing-12M; Modified Sharpe is since inception. 3 Modified Sharpe = annualized return ÷ annualized daily-return volatility (no risk-free deduction). 4 Correlation of daily returns. ICEUPWRT is calculated and published by ICE Data Indices, LLC. Index returns do not reflect any fund, fees, or expenses; one cannot invest directly in an index. Past performance is not indicative of future results. Disclosure to be finalized with compliance.
Weather data (later sections): © Open-Meteo, CC BY 4.0. | CNIC Funds LLC · Confidential — for discussion
ICEUPWRT · Monthly Index Update · September 30, 2026 4 · Daily Prices & Real-Time Spikes
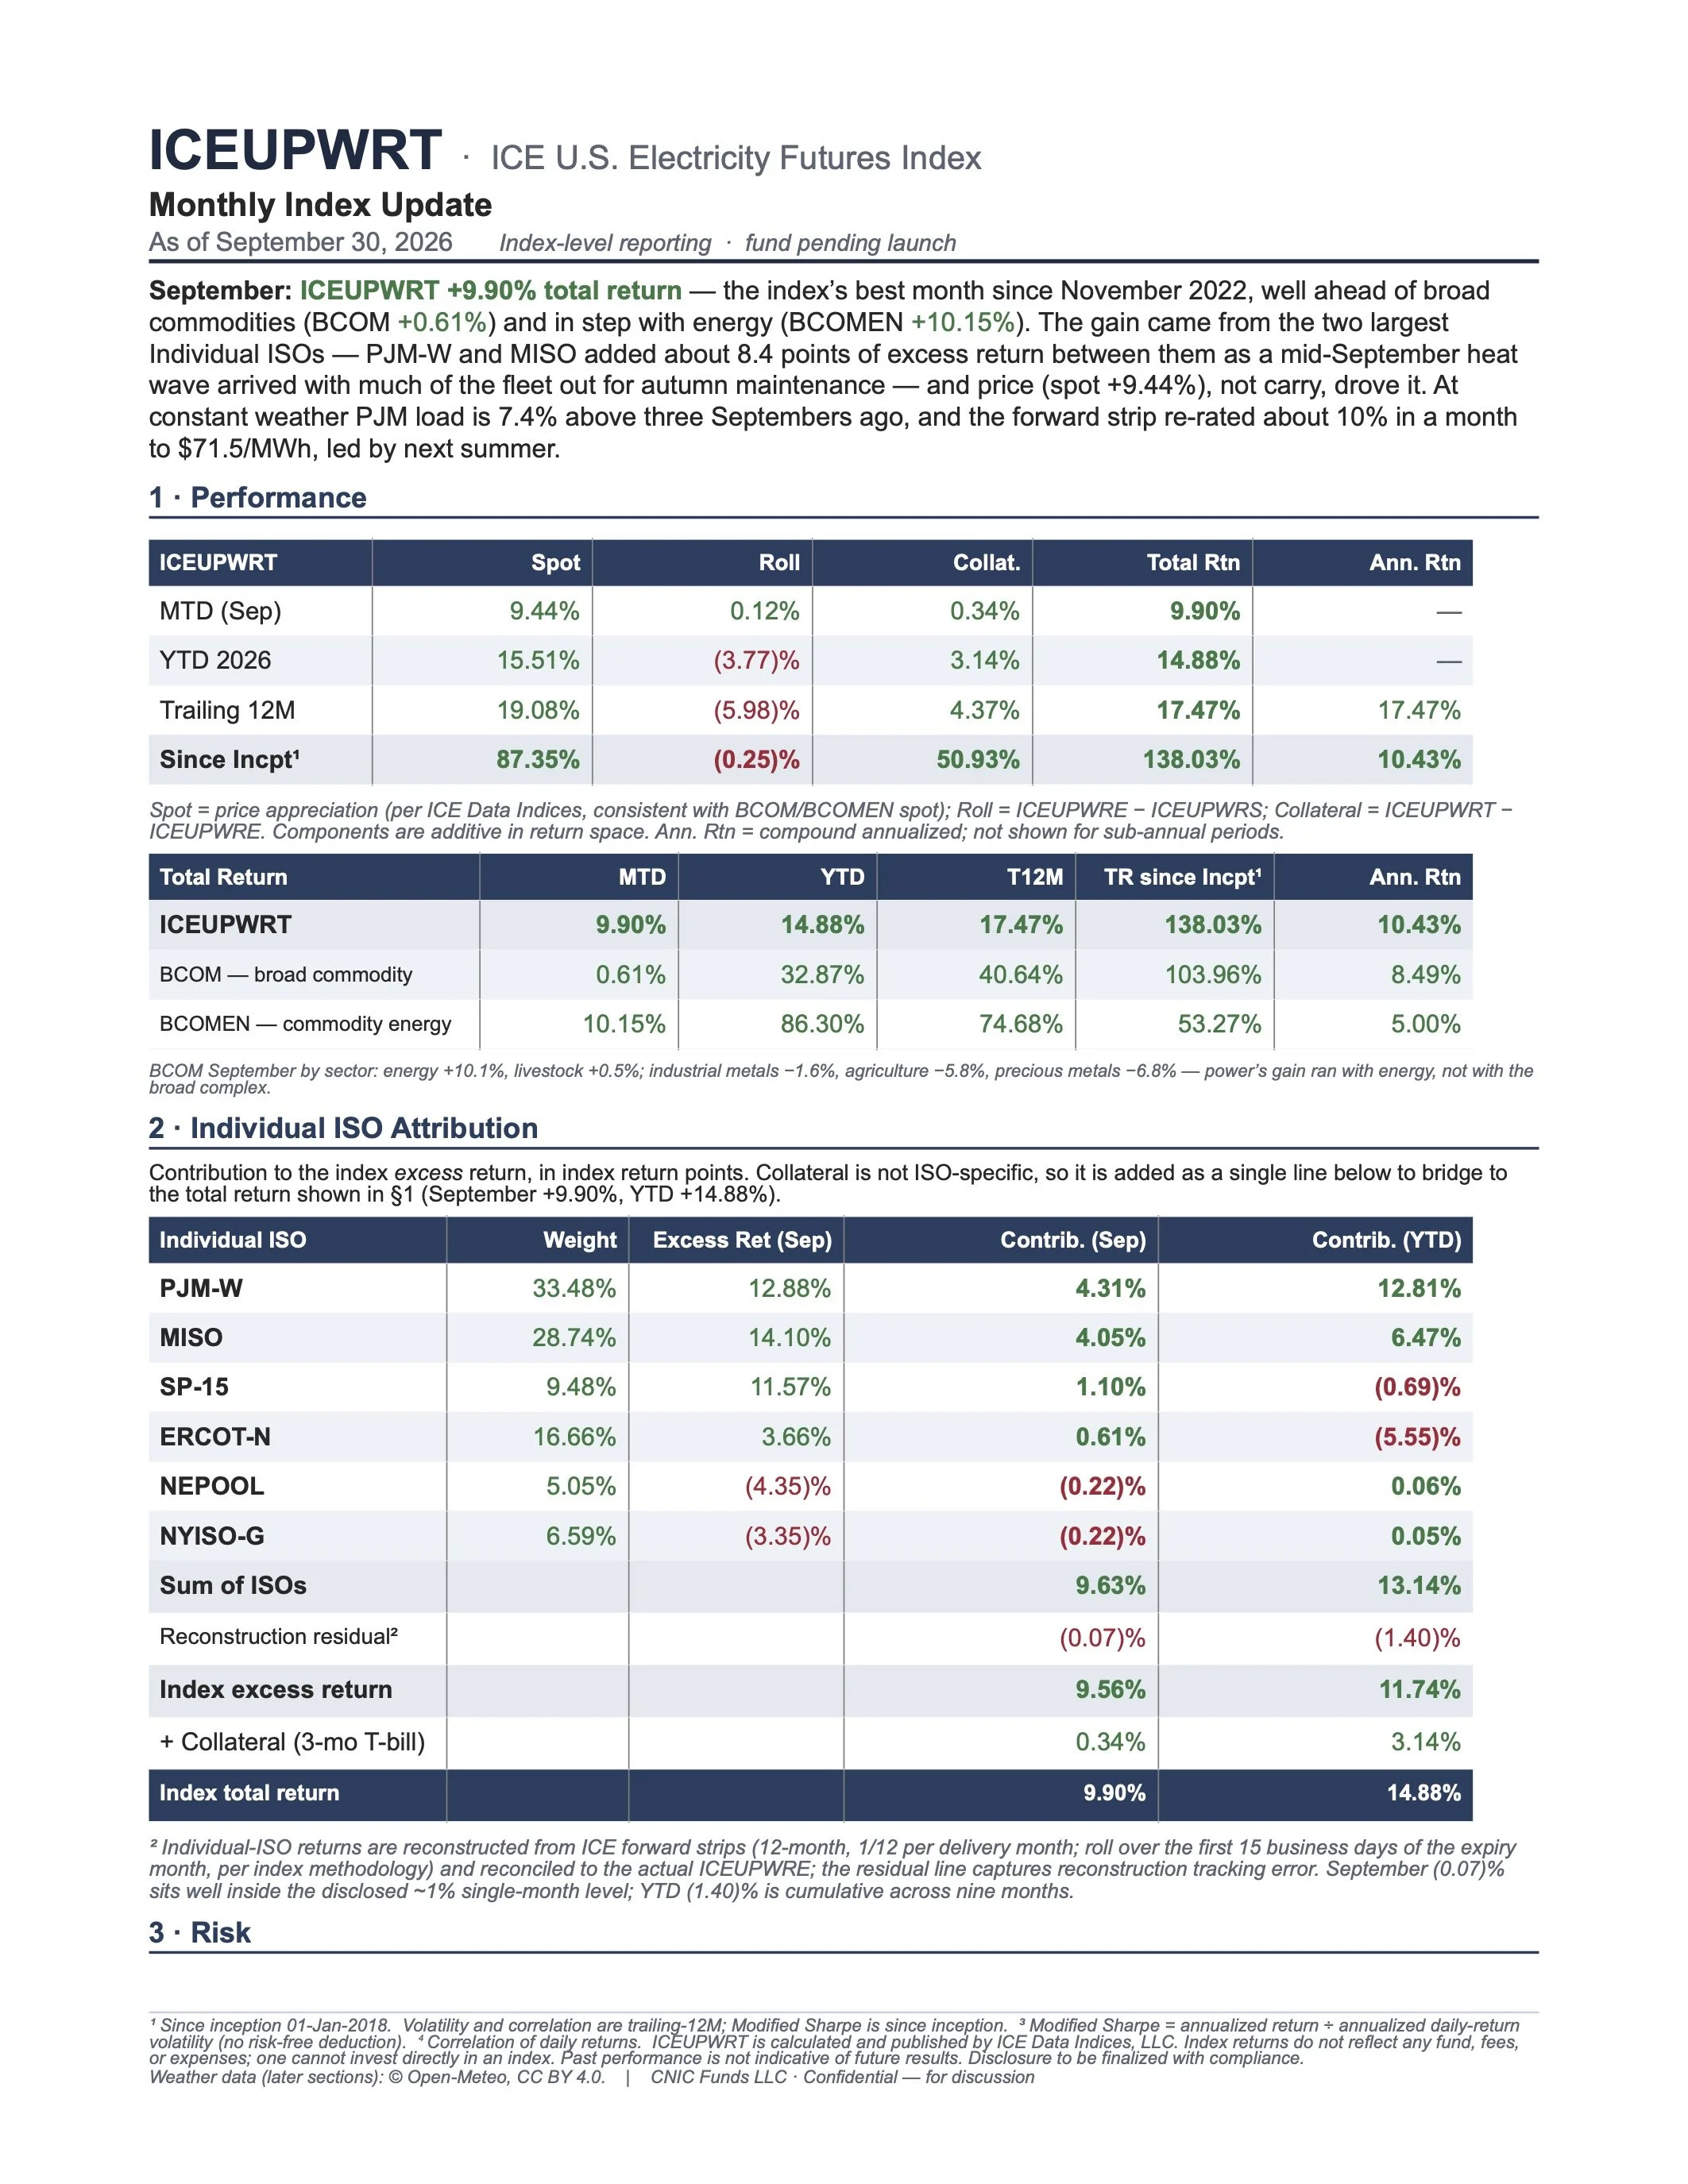
September day-ahead prices split by footprint — PJM-W averaged $68/MWh and MISO $60, well above NYISO-G ($44), NEPOOL ($41), SP-15 ($41) and ERCOT-N ($38). Real time is where the month was made: late heat arrived with roughly 36 GW of PJM generation out for autumn maintenance, and PJM-W’s daily peak reached $3,987/MWh on Sep 16 against a same-day DA average of $113; MISO followed at $7,627 on Sep 17 (DA $111), after an earlier emergency and record September peak on Sep 1–2. Dashed lines show RT daily peaks (log scale) against solid DA averages. These RT excursions inform forward and settlement moves rather than directly driving index P&L, which is futures-based.
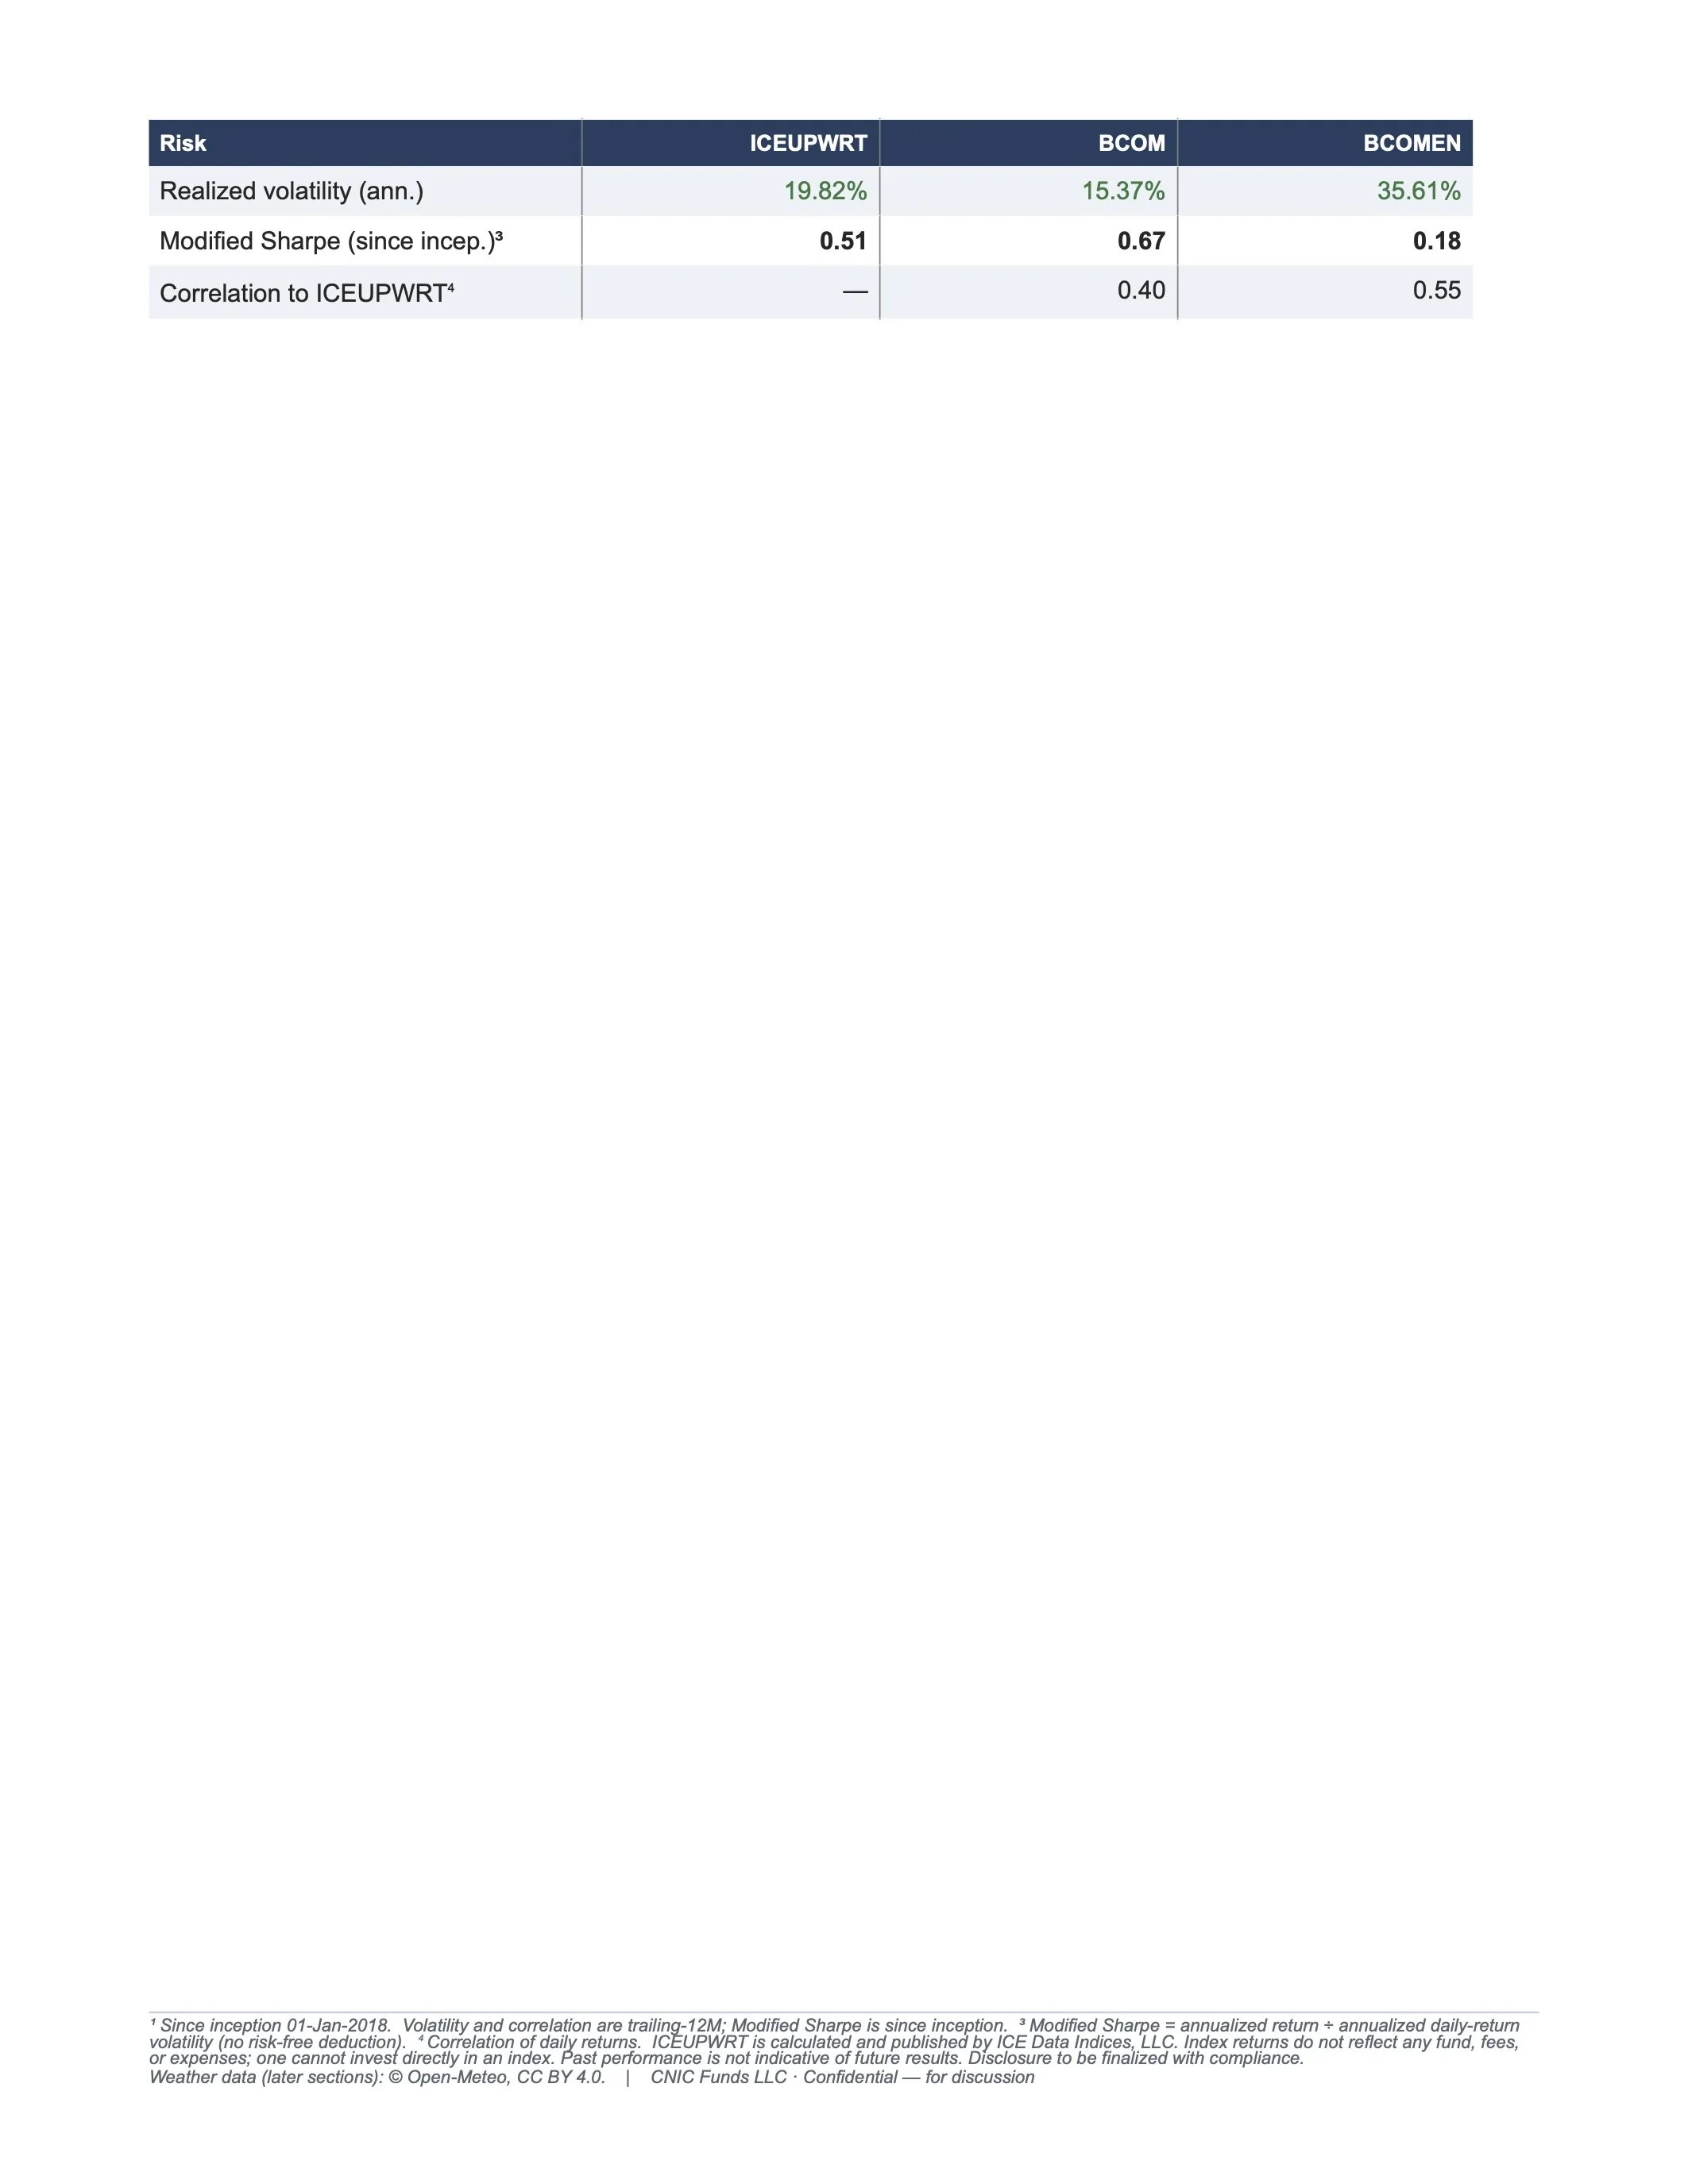
PJM-W day-ahead: 2026 against the prior three years
Daily PJM-W day-ahead average, 7-day smoothing, on a common Jan–Dec axis; shaded band = 2023–25 range, 2026 in bold. 2026 has run above the prior-year envelope for most of the summer — the Jan–Sep average is $72.8/MWh vs $32.0, $33.5 and $47.7 in 2023–25. The late-January storm peak ($495) is off scale.
1 Since inception 01-Jan-2018. Volatility and correlation are trailing-12M; Modified Sharpe is since inception. 3 Modified Sharpe = annualized return ÷ annualized daily-return volatility (no risk-free deduction). 4 Correlation of daily returns. ICEUPWRT is calculated and published by ICE Data Indices, LLC. Index returns do not reflect any fund, fees, or expenses; one cannot invest directly in an index. Past performance is not indicative of future results. Disclosure to be finalized with compliance.
Weather data (later sections): © Open-Meteo, CC BY 4.0. | CNIC Funds LLC · Confidential — for discussion
ICEUPWRT · Monthly Index Update · September 30, 2026 5 · Weather & Cooling Demand
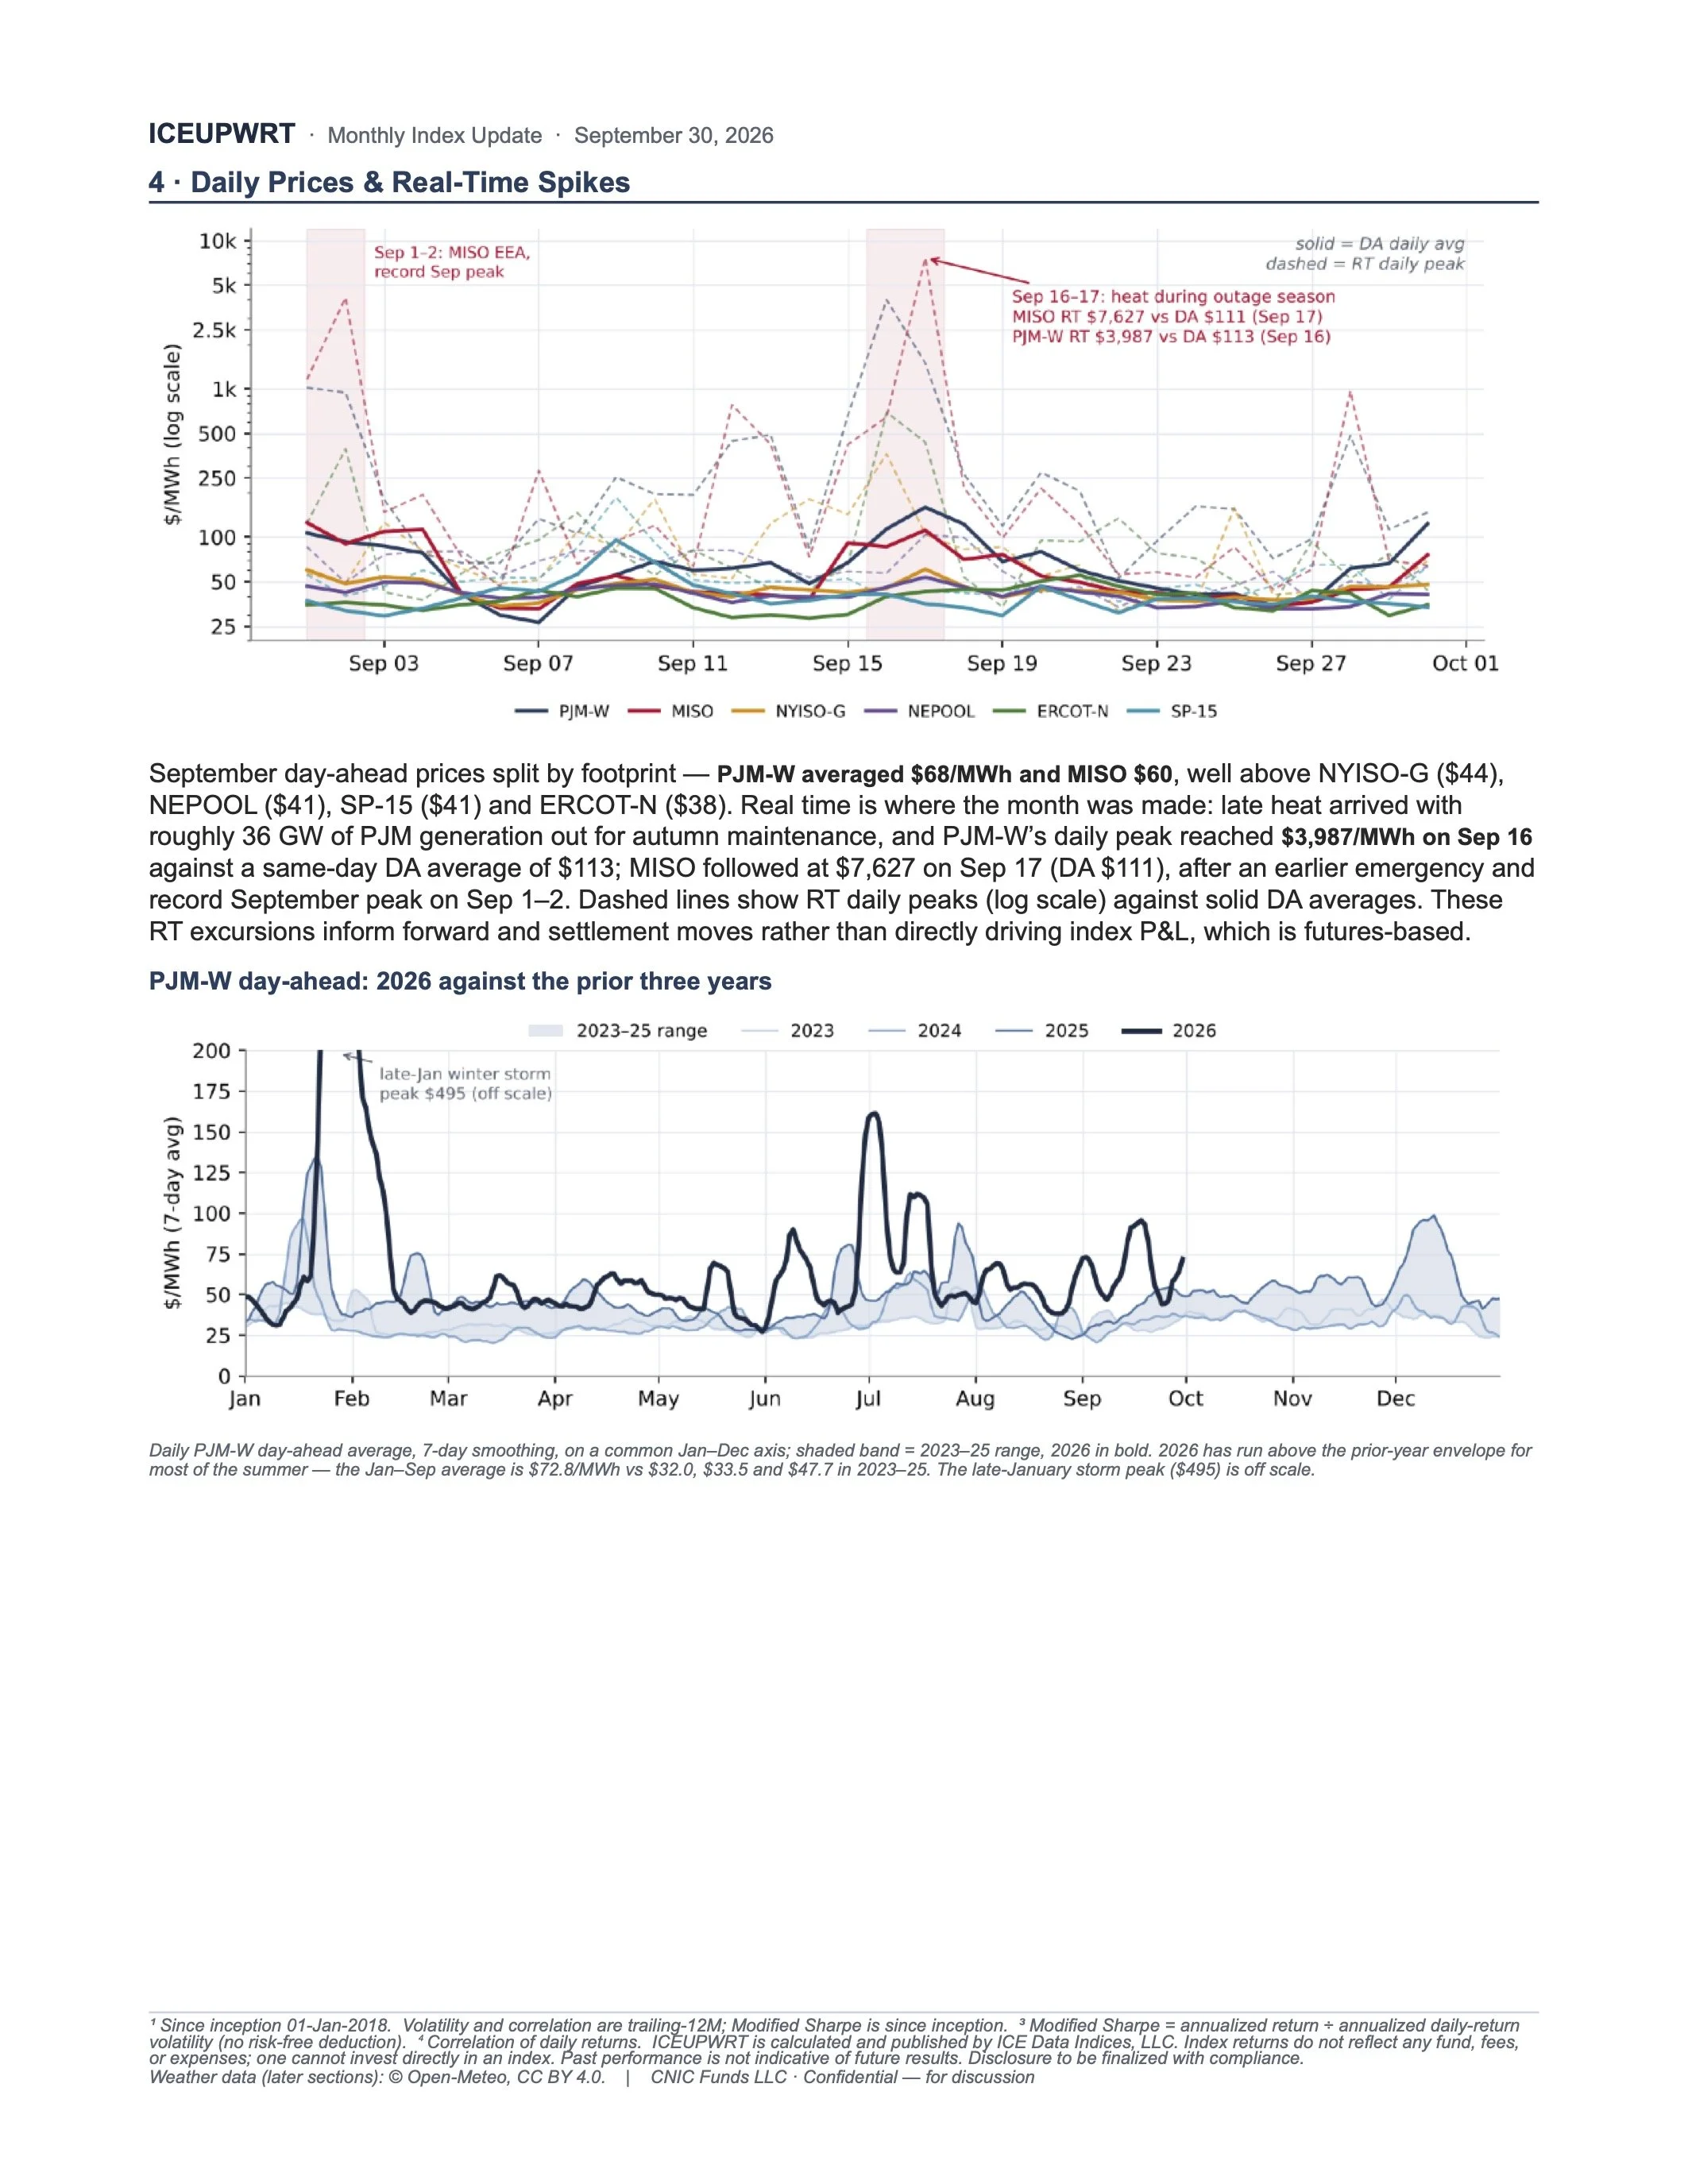
Cooling demand ran above normal across most of the footprint. Dallas led on absolute demand (683 CDD vs a 410
normal), Los Angeles ran hot (264 vs 155, +109), and the Midwest stayed warm late in the season — Chicago 182 vs
116 (+66), Pittsburgh 147 vs 85 (+62). New York was modestly warm (179 vs 159, +20) and only Boston ran cool (79 vs
91, −12). Late heat in Chicago and Pittsburgh, landing on a fleet in its maintenance window, lines up with MISO’s and
PJM-W’s outsized contributions.
Actuals: workbook CDD station feed (full month, all six cities). Normals: NOAA/NCEI 1991–2020 September CDD (base 65°F) — Pittsburgh, Boston, Chicago O’Hare, Dallas/ Fort Worth and Los Angeles airports; New York Central Park. Dallas’s actual reads a hotter station than the DFW normal, so its +273 departure overstates the true margin.
6 · Forward Curve & Term-Structure Evolution
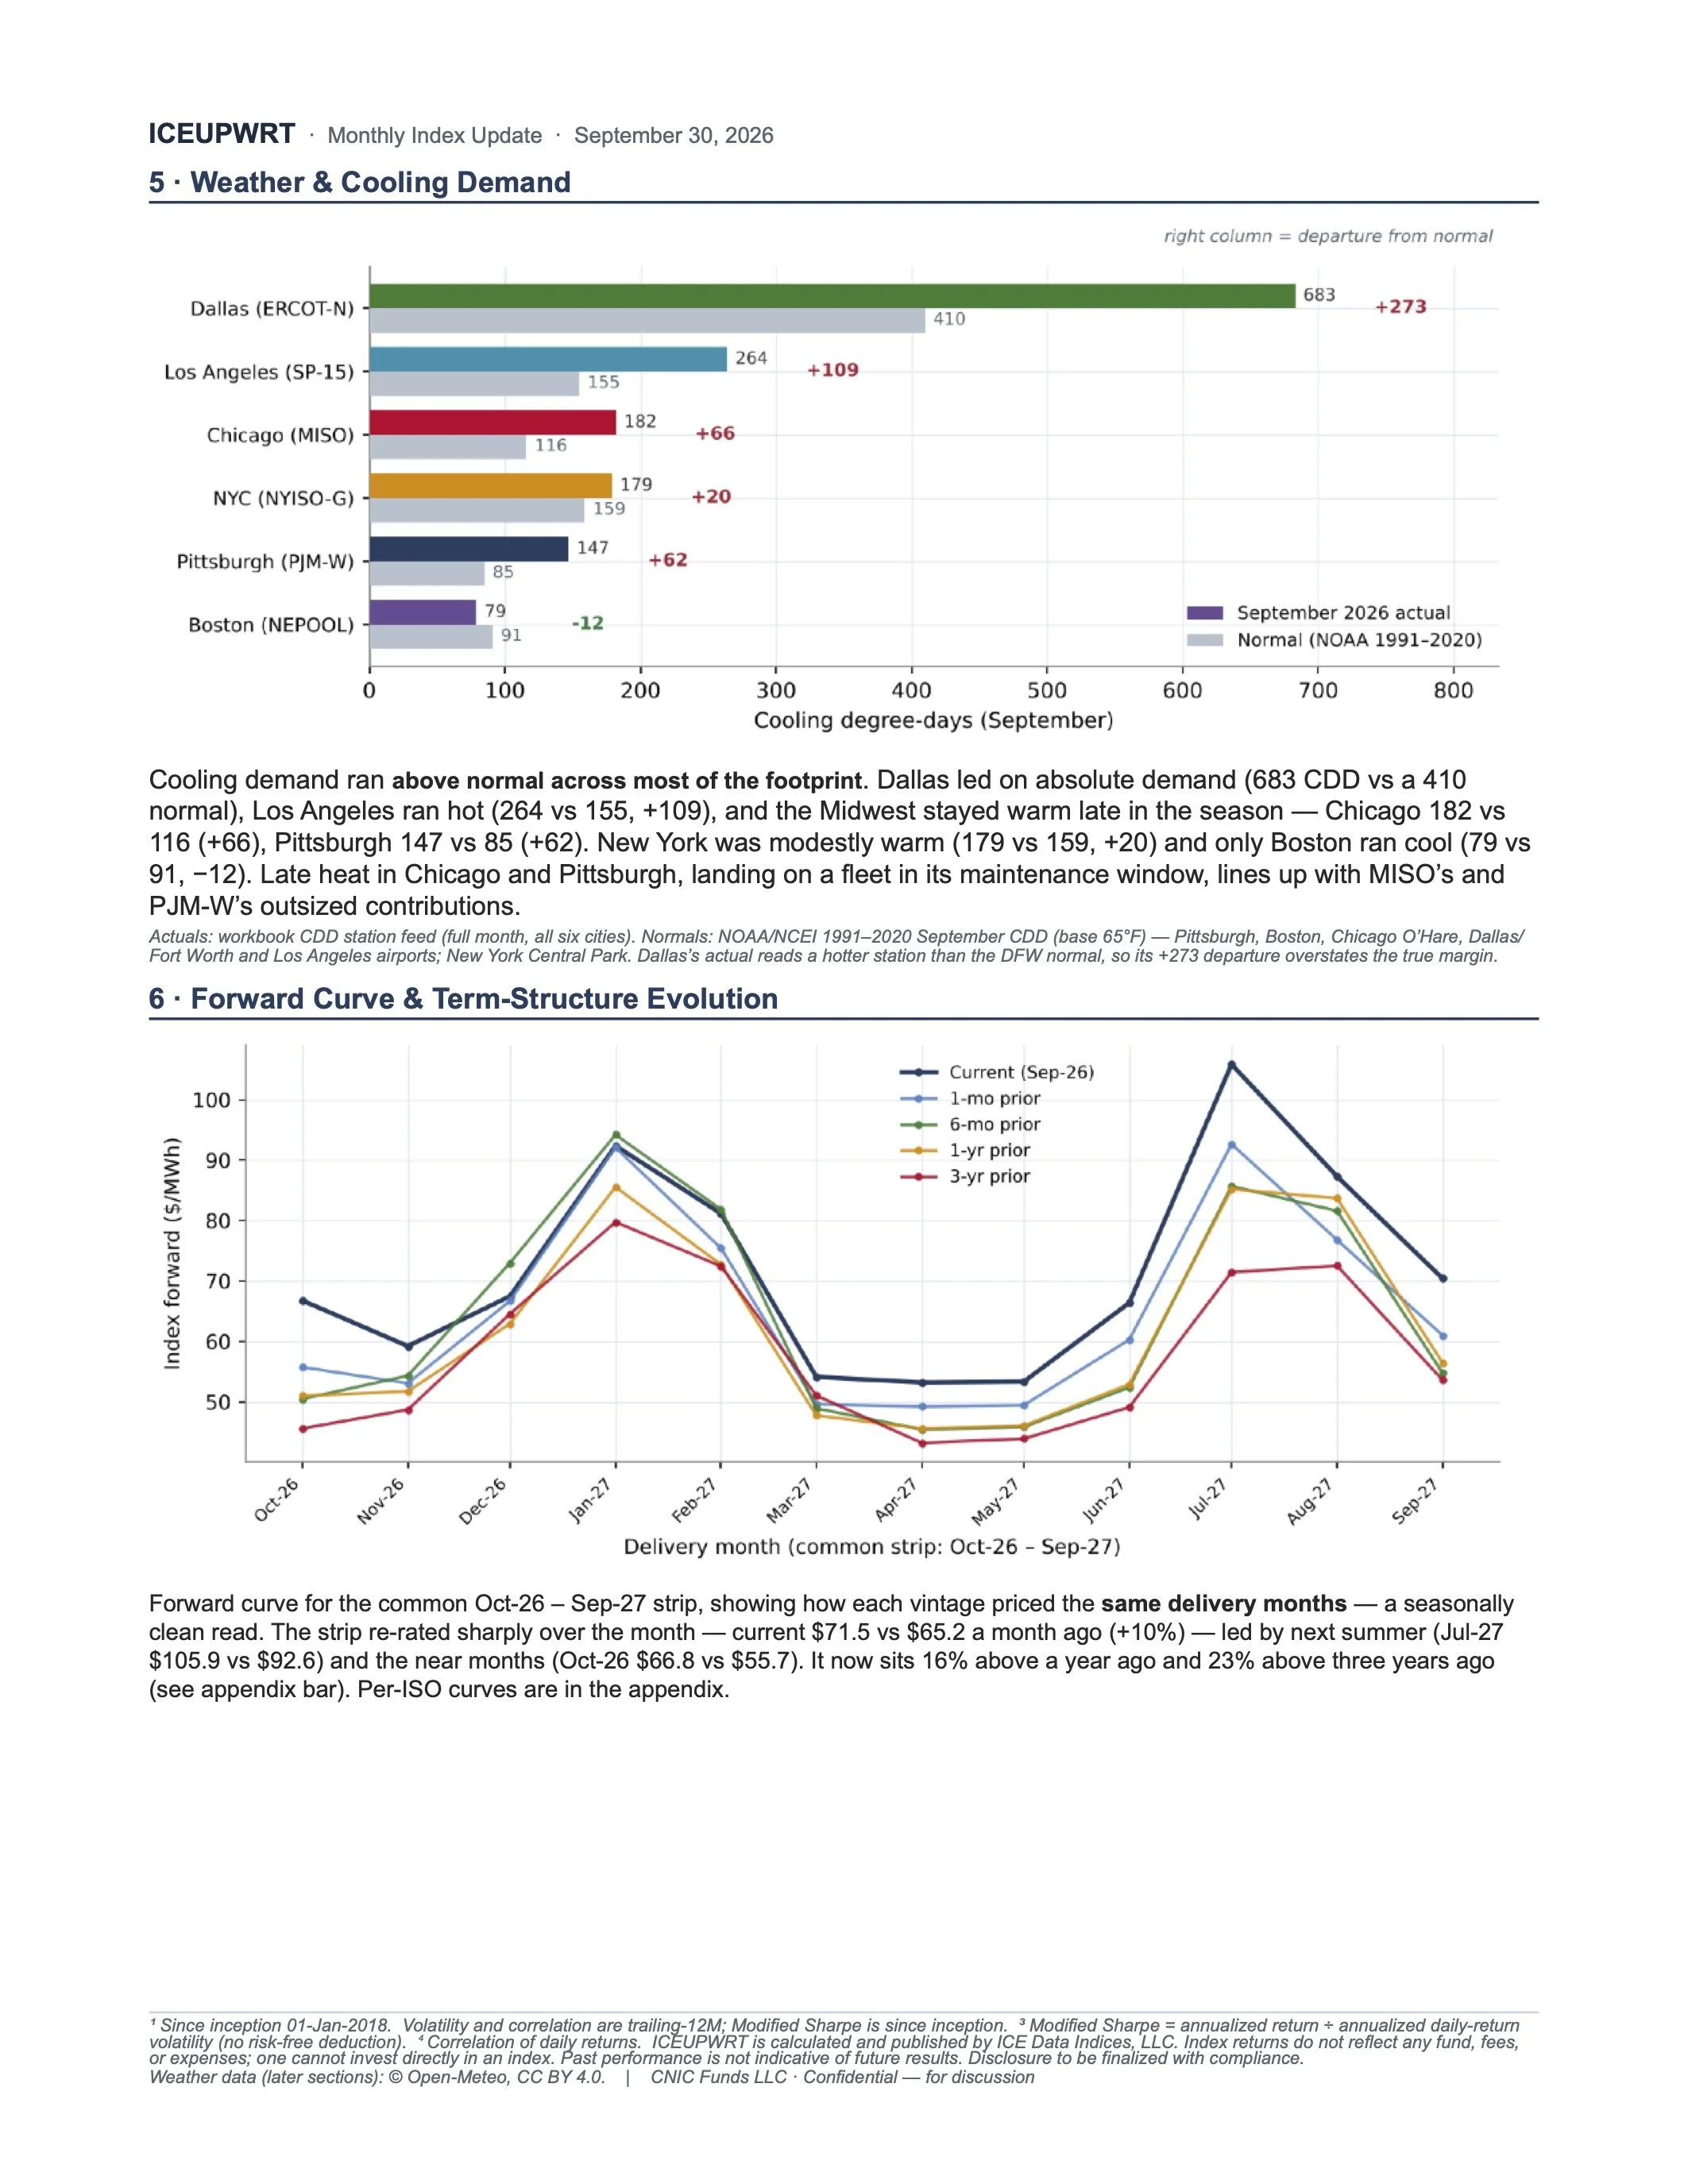
Forward curve for the common Oct-26 – Sep-27 strip, showing how each vintage priced the same delivery months — a seasonally clean read. The strip re-rated sharply over the month — current $71.5 vs $65.2 a month ago (+10%) — led by next summer (Jul-27 $105.9 vs $92.6) and the near months (Oct-26 $66.8 vs $55.7). It now sits 16% above a year ago and 23% above three years ago (see appendix bar). Per-ISO curves are in the appendix.
1 Since inception 01-Jan-2018. Volatility and correlation are trailing-12M; Modified Sharpe is since inception. 3 Modified Sharpe = annualized return ÷ annualized daily-return volatility (no risk-free deduction). 4 Correlation of daily returns. ICEUPWRT is calculated and published by ICE Data Indices, LLC. Index returns do not reflect any fund, fees, or expenses; one cannot invest directly in an index. Past performance is not indicative of future results. Disclosure to be finalized with compliance.
Weather data (later sections): © Open-Meteo, CC BY 4.0. | CNIC Funds LLC · Confidential — for discussion
ICEUPWRT · Monthly Index Update · September 30, 2026 7 · News & Commentary
Key events
▪ Heat meets maintenance season — PJM issued a Maximum Generation / Load Management Alert for Sept. 17, called pre-emergency and emergency demand response, and operated under a DOE emergency order allowing it to direct data centers and other large loads to backup generation; roughly 36 GW of generation was on outage as load approached 132 GW. Real-time prices reached $3,987/MWh at PJM-W (Sep 16) and $7,627 at MISO Indiana Hub (Sep 17). (PJM Inside Lines; workbook.)
▪ MISO sets a September record — an early-month heat dome pushed MISO into emergency procedures and its highest-ever September peak (~123 GW on Sep 2), with real-time prices briefly at the $10,000/MWh cap. (RTO Insider; Grid Status.)
▪ Data-center backstop pushed into 2027 — FERC accepted PJM’s ~6.8 GW Reliability Backstop Procurement on Sep 29 but suspended it for five months (to Feb 28, 2027), citing cost allocation, transmission-owner exit rules and collateral; PJM pulled the auction that was to open Sep 30. The capacity need does not go away — it is deferred. (Utility Dive; Bloomberg.)
▪ European gas keeps climbing — TTF rose to roughly €81/MWh by mid-September, up ~69% since June 1, keeping a bid under U.S. gas and power into winter; BCOM energy gained +10.1% in the month. (OilPriceAPI.)
▪ Real-time scarcity — day-ahead stayed comparatively calm while real time spiked on a handful of afternoons — PJM-W $3,987 RT vs $113 DA (Sep 16), MISO $7,627 vs $111 (Sep 17), ERCOT-N $694 vs $40 (Sep 16). Settlement/real-time events, not index P&L, but they mark where the grid tightened.
Structural backdrop
The demand side is unchanged and, if anything, firmer — data-center and AI load growth continues and the weather-normalized series keeps revising to the upside. The stress is on supply: new generating equipment (turbines, transformers) is hard to source and materially more expensive, and labor costs and project delays keep pushing out in-service dates. September added a new pressure point — the autumn maintenance window, historically the industry’s off-season, is being squeezed by late heat and growing baseload demand. Tight, slow-to-add supply meeting inelastic, growing demand is the structural core of the thesis — the same re-rating visible in the forward curve (§6).
Outlook
Data-center and AI demand growth is expected to persist and weather-normalized load to keep surprising to the upside, while equipment
scarcity, higher costs, and labor and interconnection delays hold supply additions behind. A strong European gas market looks set to pull U.S.
gas — and therefore power — higher into winter. Near term the market is leaning on an El Niño mild winter (Dec–Feb) and is unsure how to
price the months beyond; the backstop delay leaves PJM’s capacity shortfall unresolved into 2027, and September showed how little slack the
system has outside peak season.
Key events reflect workbook data plus publicly reported September 2026 developments; the forward view is the CNIC market desk’s. Sources: PJM Inside Lines; RTO Insider; Grid Status; Utility Dive; Bloomberg; OilPriceAPI.
1 Since inception 01-Jan-2018. Volatility and correlation are trailing-12M; Modified Sharpe is since inception. 3 Modified Sharpe = annualized return ÷ annualized daily-return volatility (no risk-free deduction). 4 Correlation of daily returns. ICEUPWRT is calculated and published by ICE Data Indices, LLC. Index returns do not reflect any fund, fees, or expenses; one cannot invest directly in an index. Past performance is not indicative of future results. Disclosure to be finalized with compliance.
Weather data (later sections): © Open-Meteo, CC BY 4.0. | CNIC Funds LLC · Confidential — for discussion
ICEUPWRT · Monthly Index Update · September 30, 2026 8 · Weather-Normalized Load & Price
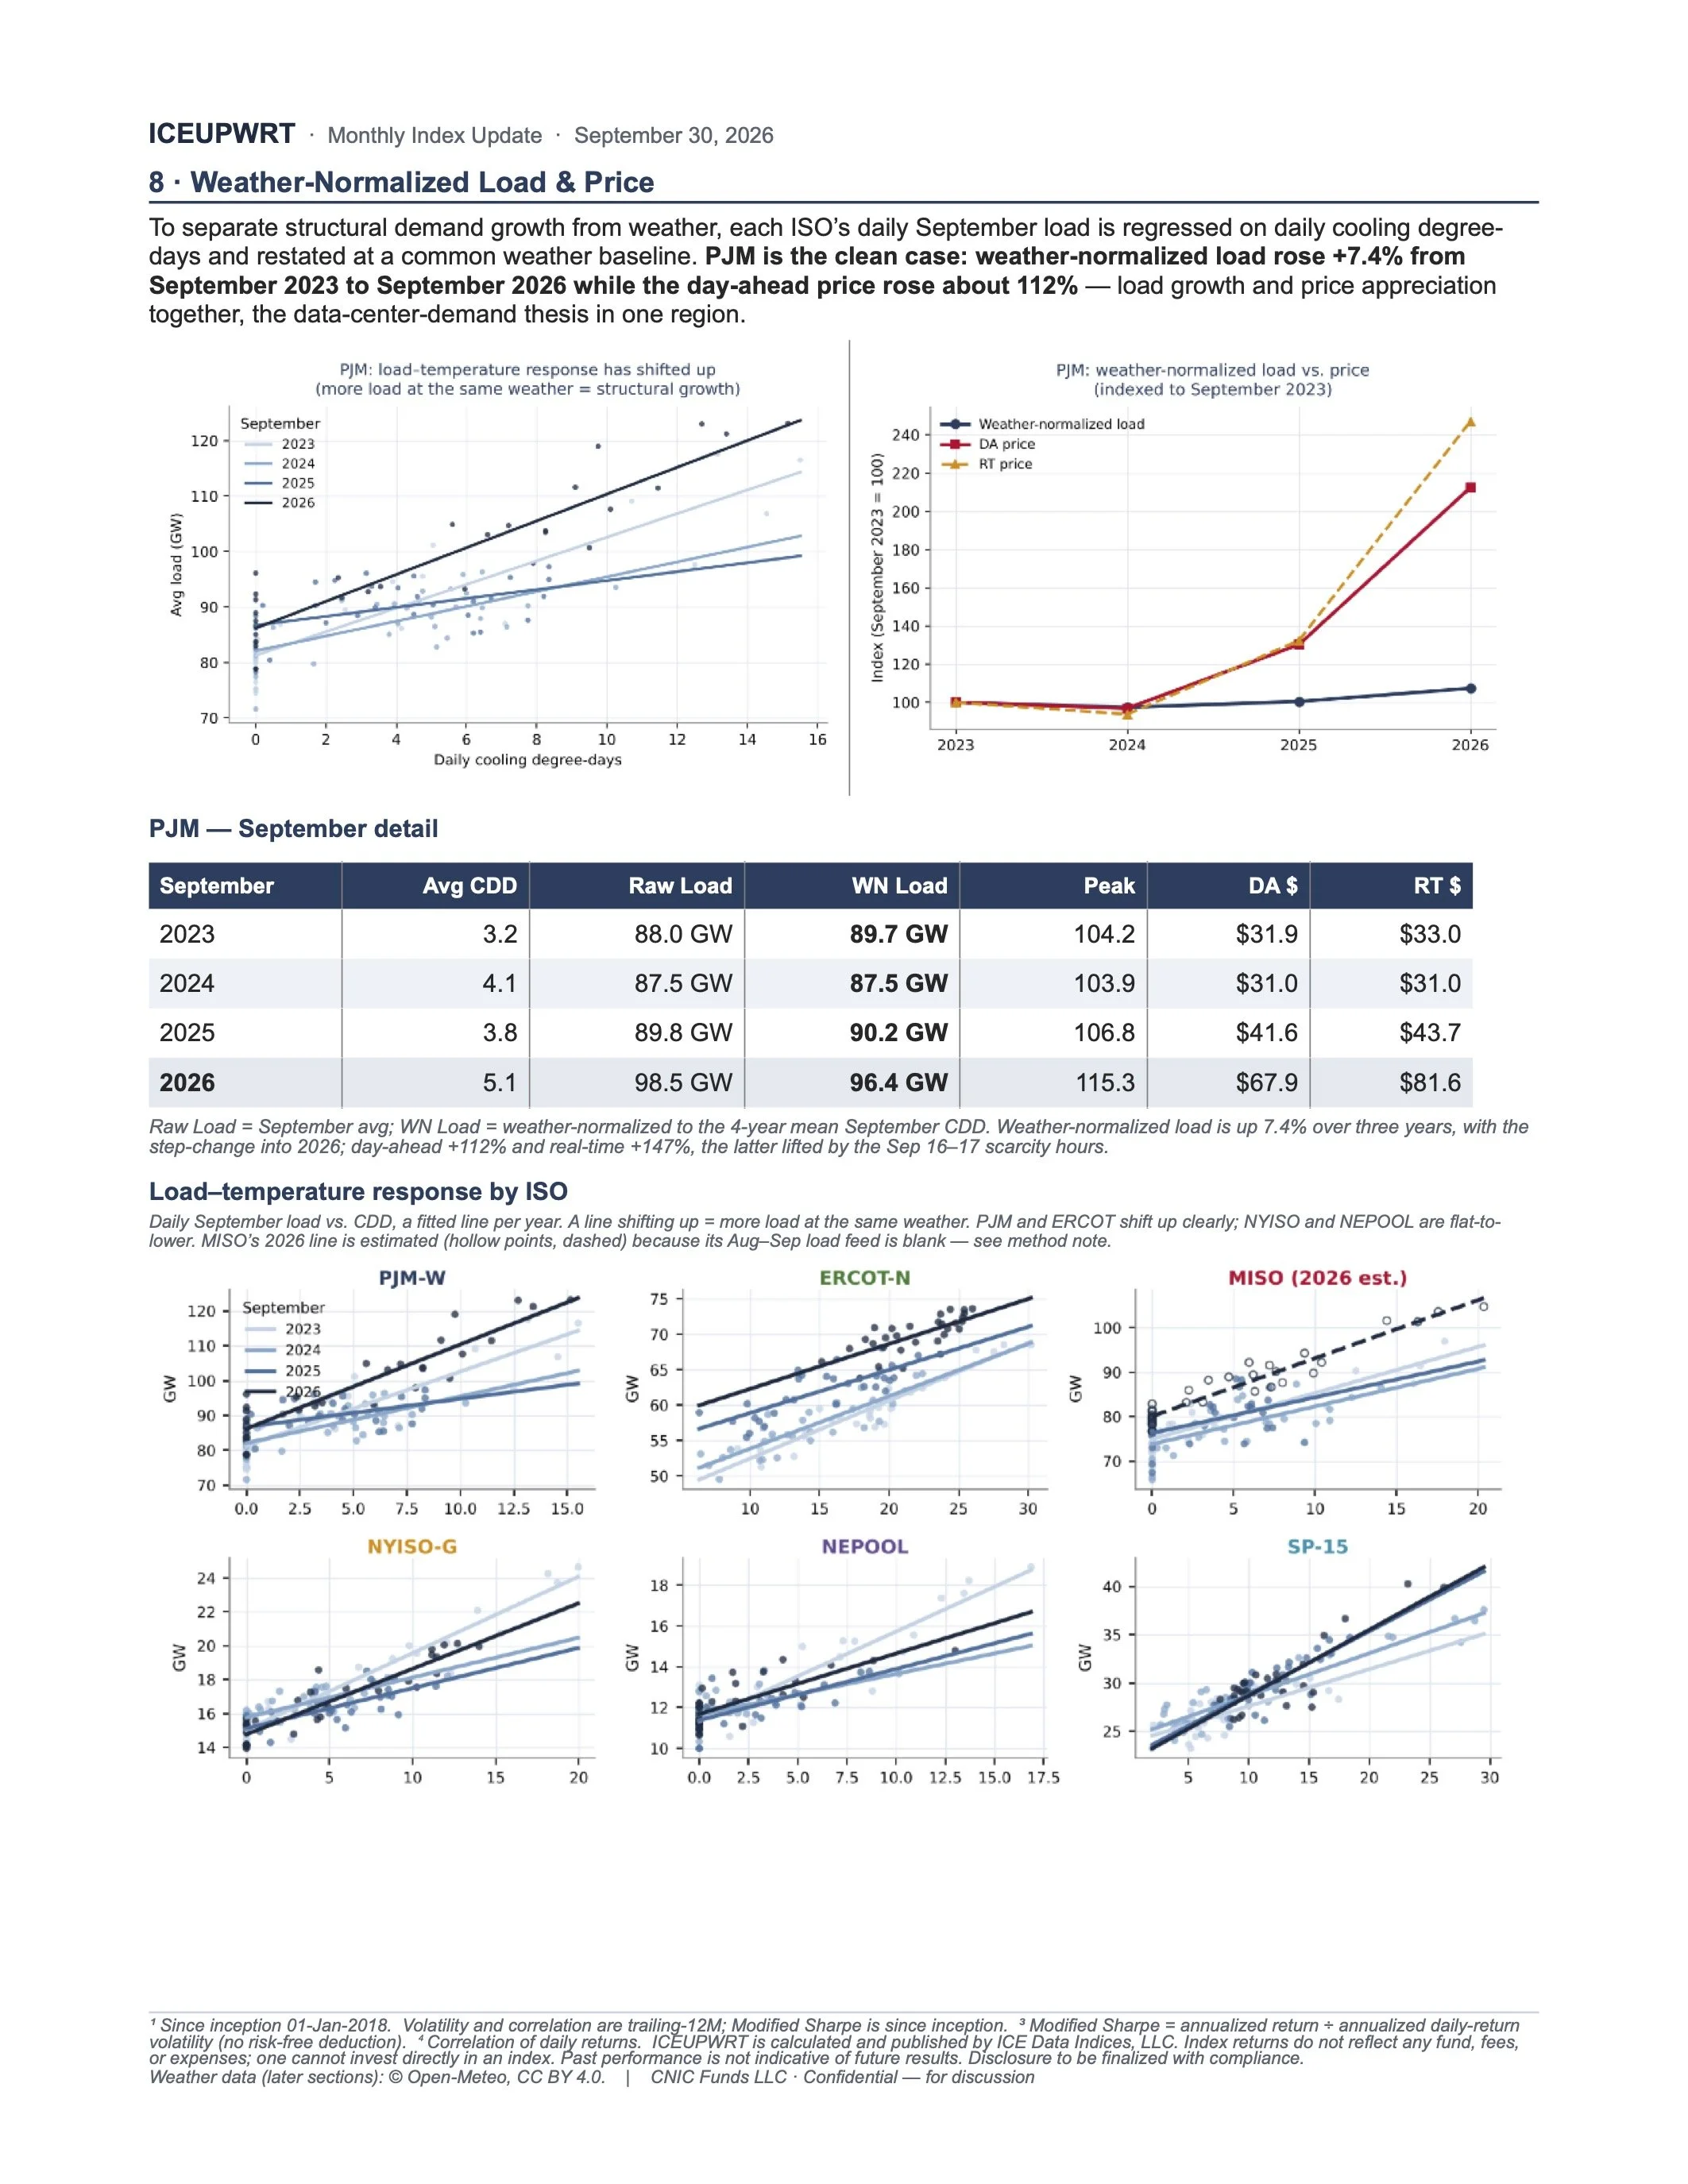
To separate structural demand growth from weather, each ISO’s daily September load is regressed on daily cooling degree- days and restated at a common weather baseline. PJM is the clean case: weather-normalized load rose +7.4% from September 2023 to September 2026 while the day-ahead price rose about 112% — load growth and price appreciation together, the data-center-demand thesis in one region.
PJM — September detail
2023 $33.0 2025 $43.7
Raw Load = September avg; WN Load = weather-normalized to the 4-year mean September CDD. Weather-normalized load is up 7.4% over three years, with the step-change into 2026; day-ahead +112% and real-time +147%, the latter lifted by the Sep 16–17 scarcity hours.
Load–temperature response by ISO
Daily September load vs. CDD, a fitted line per year. A line shifting up = more load at the same weather. PJM and ERCOT shift up clearly; NYISO and NEPOOL are flat-to- lower. MISO’s 2026 line is estimated (hollow points, dashed) because its Aug–Sep load feed is blank — see method note.
September
2024
2026
Avg CDD
3.2
4.1
3.8
5.1
Raw Load
88.0 GW
87.5 GW
89.8 GW
98.5 GW
WN Load
89.7 GW
87.5 GW
90.2 GW
96.4 GW
Peak
104.2
103.9
106.8
115.3
$31.9
$31.0
$41.6
$67.9
$81.6
1 Since inception 01-Jan-2018. Volatility and correlation are trailing-12M; Modified Sharpe is since inception. 3 Modified Sharpe = annualized return ÷ annualized daily-return volatility (no risk-free deduction). 4 Correlation of daily returns. ICEUPWRT is calculated and published by ICE Data Indices, LLC. Index returns do not reflect any fund, fees, or expenses; one cannot invest directly in an index. Past performance is not indicative of future results. Disclosure to be finalized with compliance.
Weather data (later sections): © Open-Meteo, CC BY 4.0. | CNIC Funds LLC · Confidential — for discussion
DA $
RT $
$31.0
Cross-ISO summary
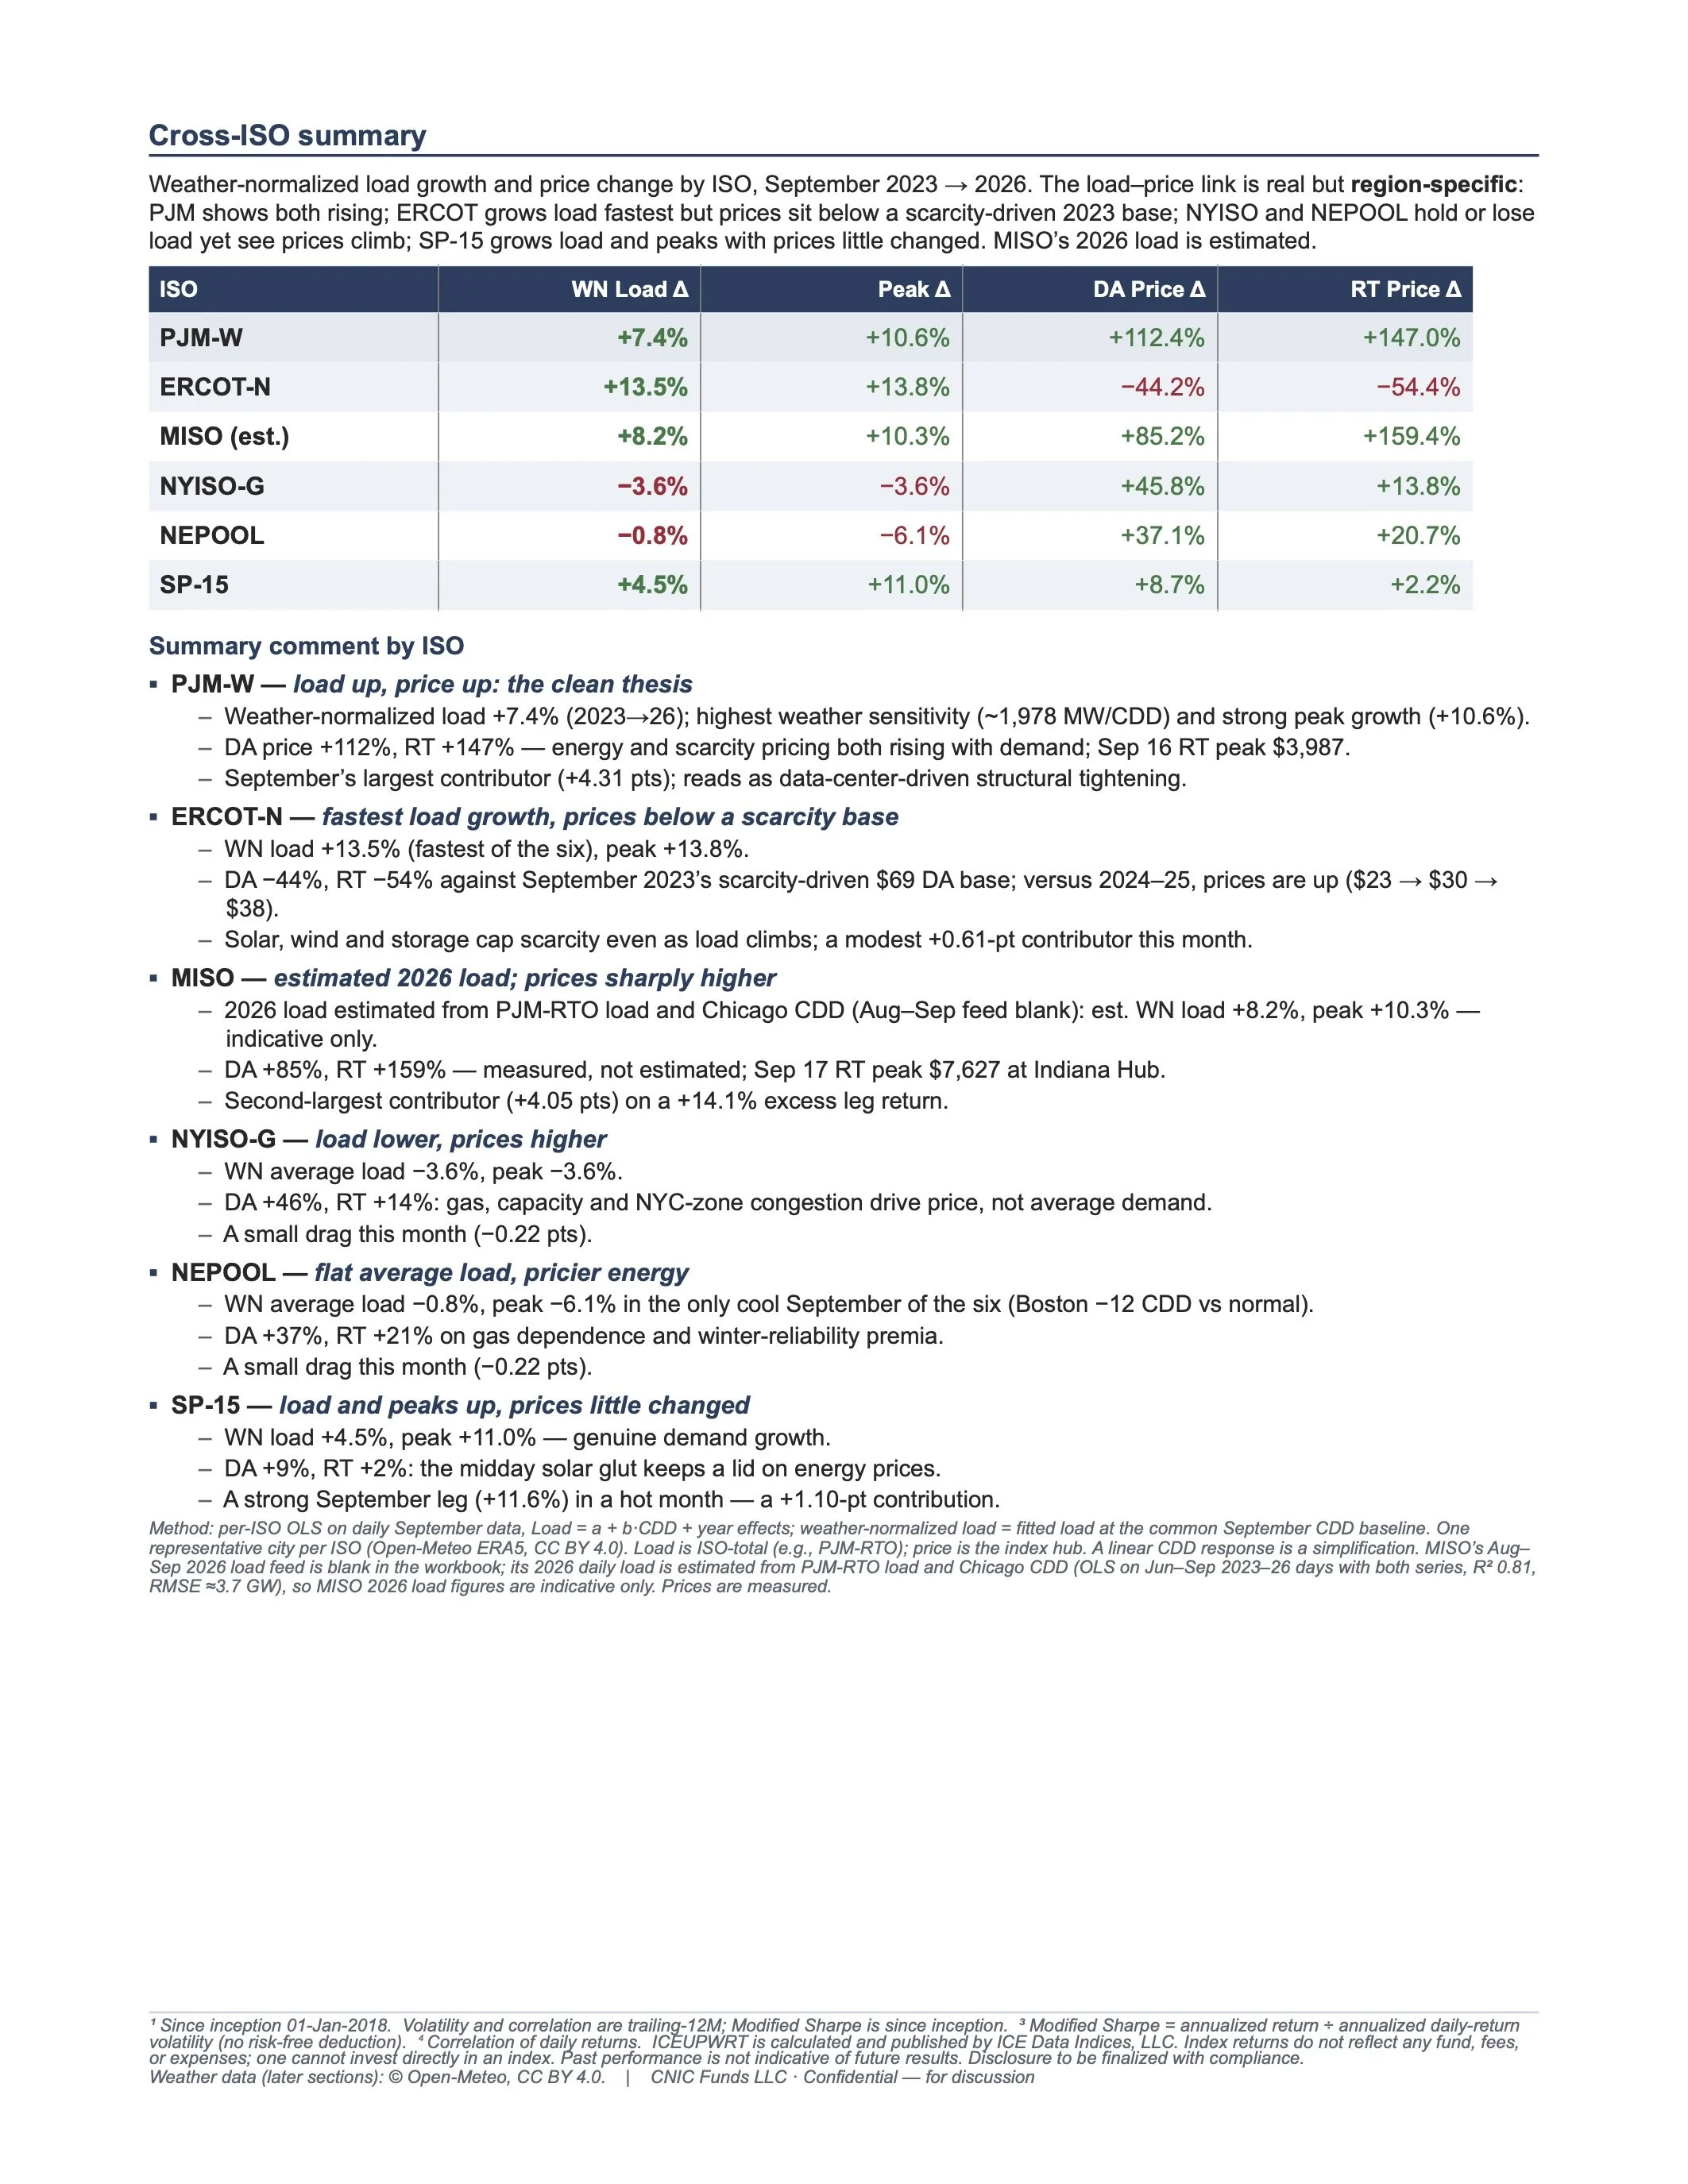
Weather-normalized load growth and price change by ISO, September 2023 → 2026. The load–price link is real but region-specific: PJM shows both rising; ERCOT grows load fastest but prices sit below a scarcity-driven 2023 base; NYISO and NEPOOL hold or lose load yet see prices climb; SP-15 grows load and peaks with prices little changed. MISO’s 2026 load is estimated.
MISO (est.) +159.4% NEPOOL +20.7%
Summary comment by ISO
▪ PJM-W — load up, price up: the clean thesis
– Weather-normalized load +7.4% (2023→26); highest weather sensitivity (~1,978 MW/CDD) and strong peak growth (+10.6%). – DA price +112%, RT +147% — energy and scarcity pricing both rising with demand; Sep 16 RT peak $3,987.
– September’s largest contributor (+4.31 pts); reads as data-center-driven structural tightening.
▪ ERCOT-N — fastest load growth, prices below a scarcity base
– WN load +13.5% (fastest of the six), peak +13.8%.
– DA −44%, RT −54% against September 2023’s scarcity-driven $69 DA base; versus 2024–25, prices are up ($23 → $30 →
$38).
– Solar, wind and storage cap scarcity even as load climbs; a modest +0.61-pt contributor this month.
▪ MISO — estimated 2026 load; prices sharply higher
– 2026 load estimated from PJM-RTO load and Chicago CDD (Aug–Sep feed blank): est. WN load +8.2%, peak +10.3% —
indicative only.
– DA +85%, RT +159% — measured, not estimated; Sep 17 RT peak $7,627 at Indiana Hub. – Second-largest contributor (+4.05 pts) on a +14.1% excess leg return.
▪ NYISO-G — load lower, prices higher
– WN average load −3.6%, peak −3.6%.
– DA +46%, RT +14%: gas, capacity and NYC-zone congestion drive price, not average demand. – A small drag this month (−0.22 pts).
▪ NEPOOL — flat average load, pricier energy
– WN average load −0.8%, peak −6.1% in the only cool September of the six (Boston −12 CDD vs normal). – DA +37%, RT +21% on gas dependence and winter-reliability premia.
– A small drag this month (−0.22 pts).
▪ SP-15 — load and peaks up, prices little changed
– WN load +4.5%, peak +11.0% — genuine demand growth.
– DA +9%, RT +2%: the midday solar glut keeps a lid on energy prices.
– A strong September leg (+11.6%) in a hot month — a +1.10-pt contribution.
Method: per-ISO OLS on daily September data, Load = a + b·CDD + year effects; weather-normalized load = fitted load at the common September CDD baseline. One representative city per ISO (Open-Meteo ERA5, CC BY 4.0). Load is ISO-total (e.g., PJM-RTO); price is the index hub. A linear CDD response is a simplification. MISO’s Aug– Sep 2026 load feed is blank in the workbook; its 2026 daily load is estimated from PJM-RTO load and Chicago CDD (OLS on Jun–Sep 2023–26 days with both series, R2 0.81, RMSE ≈3.7 GW), so MISO 2026 load figures are indicative only. Prices are measured.
ISO
PJM-W
ERCOT-N
NYISO-G
SP-15
WN Load Δ
+7.4%
+13.5%
+8.2%
−3.6%
−0.8%
+4.5%
Peak Δ
+10.6%
+13.8%
+10.3%
−3.6%
−6.1%
+11.0%
DA Price Δ
+112.4%
−44.2%
+85.2%
+45.8%
+37.1%
+8.7%
RT Price Δ
+147.0%
−54.4%
+13.8%
+2.2%
1 Since inception 01-Jan-2018. Volatility and correlation are trailing-12M; Modified Sharpe is since inception. 3 Modified Sharpe = annualized return ÷ annualized daily-return volatility (no risk-free deduction). 4 Correlation of daily returns. ICEUPWRT is calculated and published by ICE Data Indices, LLC. Index returns do not reflect any fund, fees, or expenses; one cannot invest directly in an index. Past performance is not indicative of future results. Disclosure to be finalized with compliance.
Weather data (later sections): © Open-Meteo, CC BY 4.0. | CNIC Funds LLC · Confidential — for discussion
ICEUPWRT · Appendix · September 30, 2026 Appendix · Per-ISO Term Structure
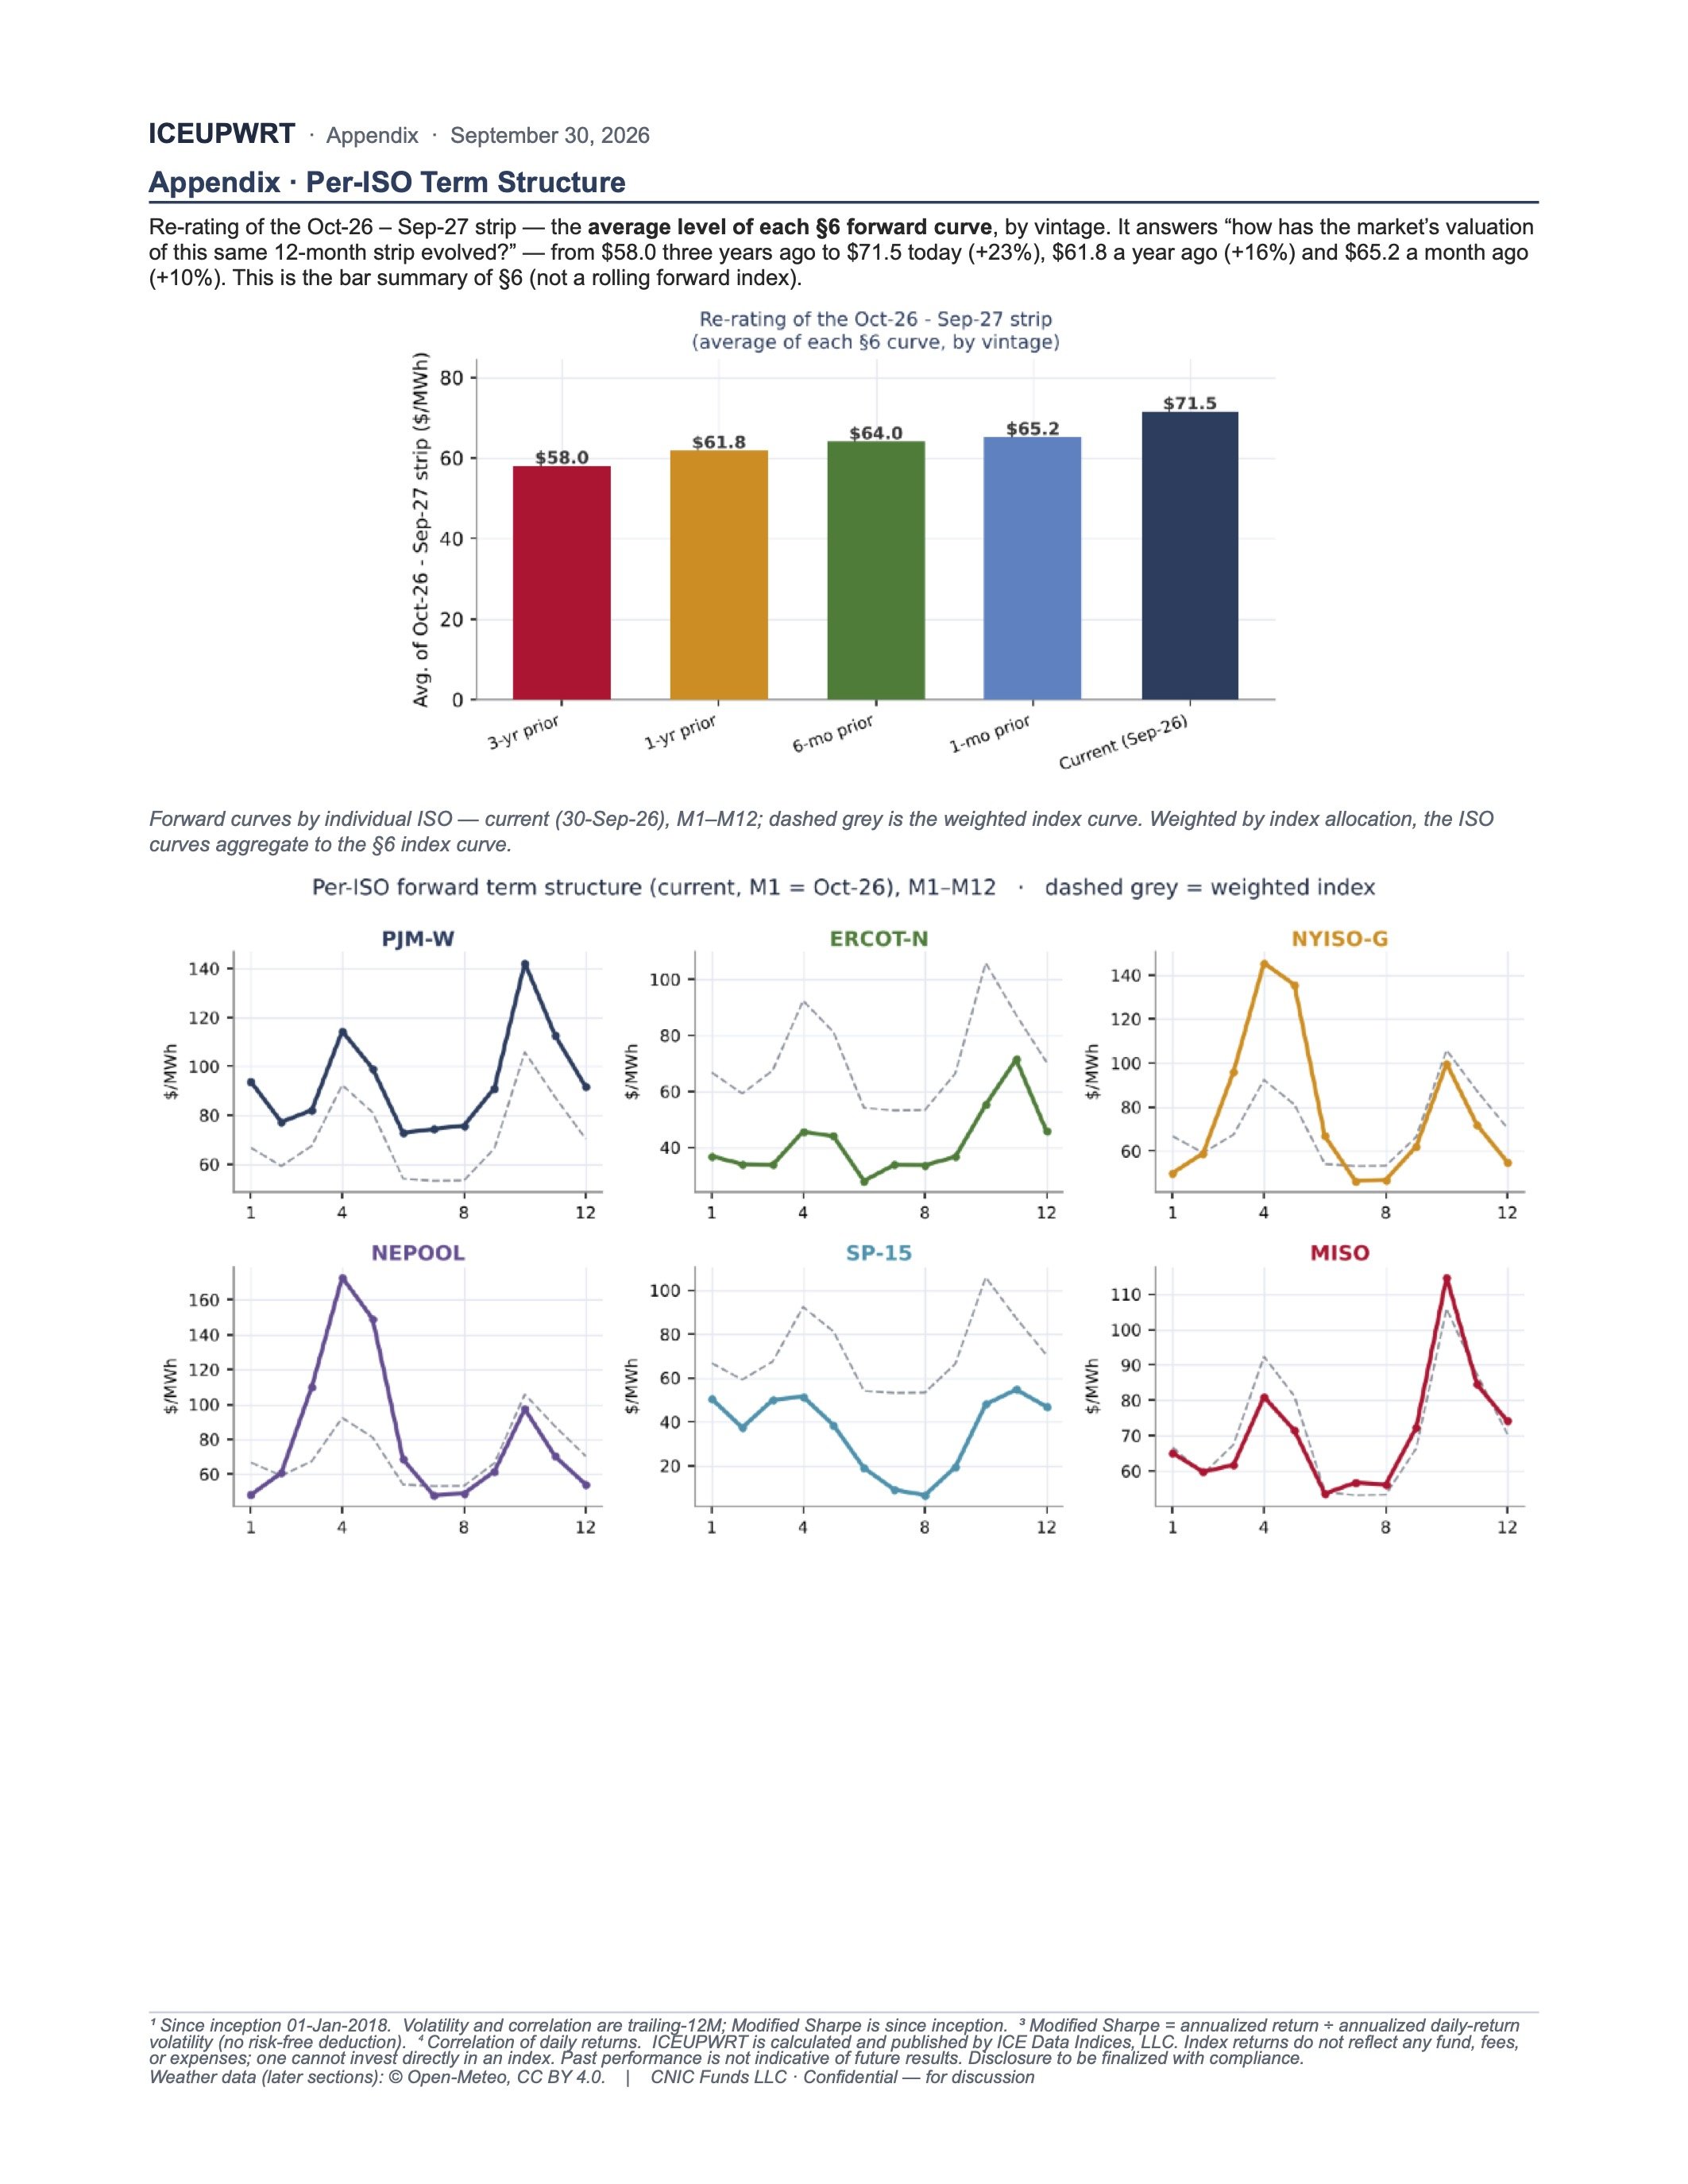
Re-rating of the Oct-26 – Sep-27 strip — the average level of each §6 forward curve, by vintage. It answers “how has the market’s valuation of this same 12-month strip evolved?” — from $58.0 three years ago to $71.5 today (+23%), $61.8 a year ago (+16%) and $65.2 a month ago (+10%). This is the bar summary of §6 (not a rolling forward index).
Forward curves by individual ISO — current (30-Sep-26), M1–M12; dashed grey is the weighted index curve. Weighted by index allocation, the ISO curves aggregate to the §6 index curve.
1 Since inception 01-Jan-2018. Volatility and correlation are trailing-12M; Modified Sharpe is since inception. 3 Modified Sharpe = annualized return ÷ annualized daily-return volatility (no risk-free deduction). 4 Correlation of daily returns. ICEUPWRT is calculated and published by ICE Data Indices, LLC. Index returns do not reflect any fund, fees, or expenses; one cannot invest directly in an index. Past performance is not indicative of future results. Disclosure to be finalized with compliance.
Weather data (later sections): © Open-Meteo, CC BY 4.0. | CNIC Funds LLC · Confidential — for discussion
