
1-Month Power Index
At a Glance
The 1-Month Power Index provides focused exposure to the prompt U.S. electricity market through a fixed-weight basket of next-month futures across six major power hubs. By concentrating on the front of the curve, the index captures more of the weather, outage, and scarcity-driven volatility that defines short-term power markets.
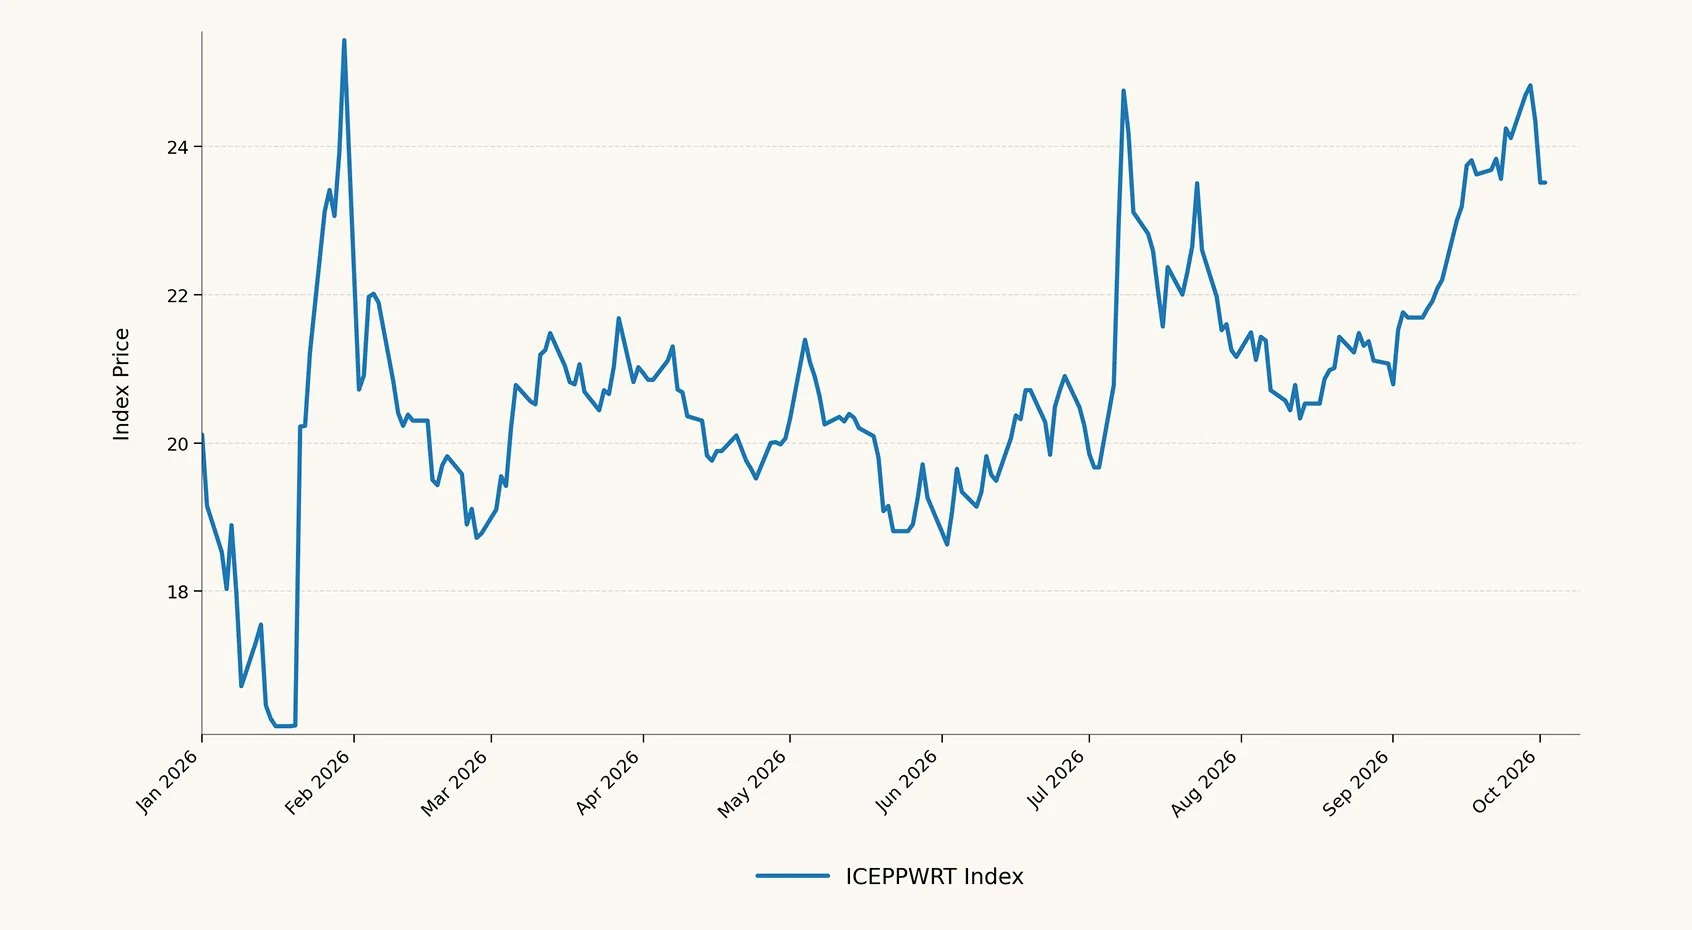
Index
ICE U.S. Prompt Power Total Return Index
Ticker
ICEPPWRT
Market
U.S. Electricity
Coverage
6 Major Power Hubs
Methodology
Fixed-weight, rules-based total return
Power Index Daily CloseLast Updated October 1, 2026
The Growing Importance of Power
Electricity is one of the most essential commodities in the U.S. economy, yet direct exposure has historically been difficult to access through conventional investment products.
Demand for power continues to evolve alongside AI, data centers, electrification, manufacturing, transportation, and broader economic growth. CNIC’s Power Index is designed to provide a structured way to track this increasingly important market.
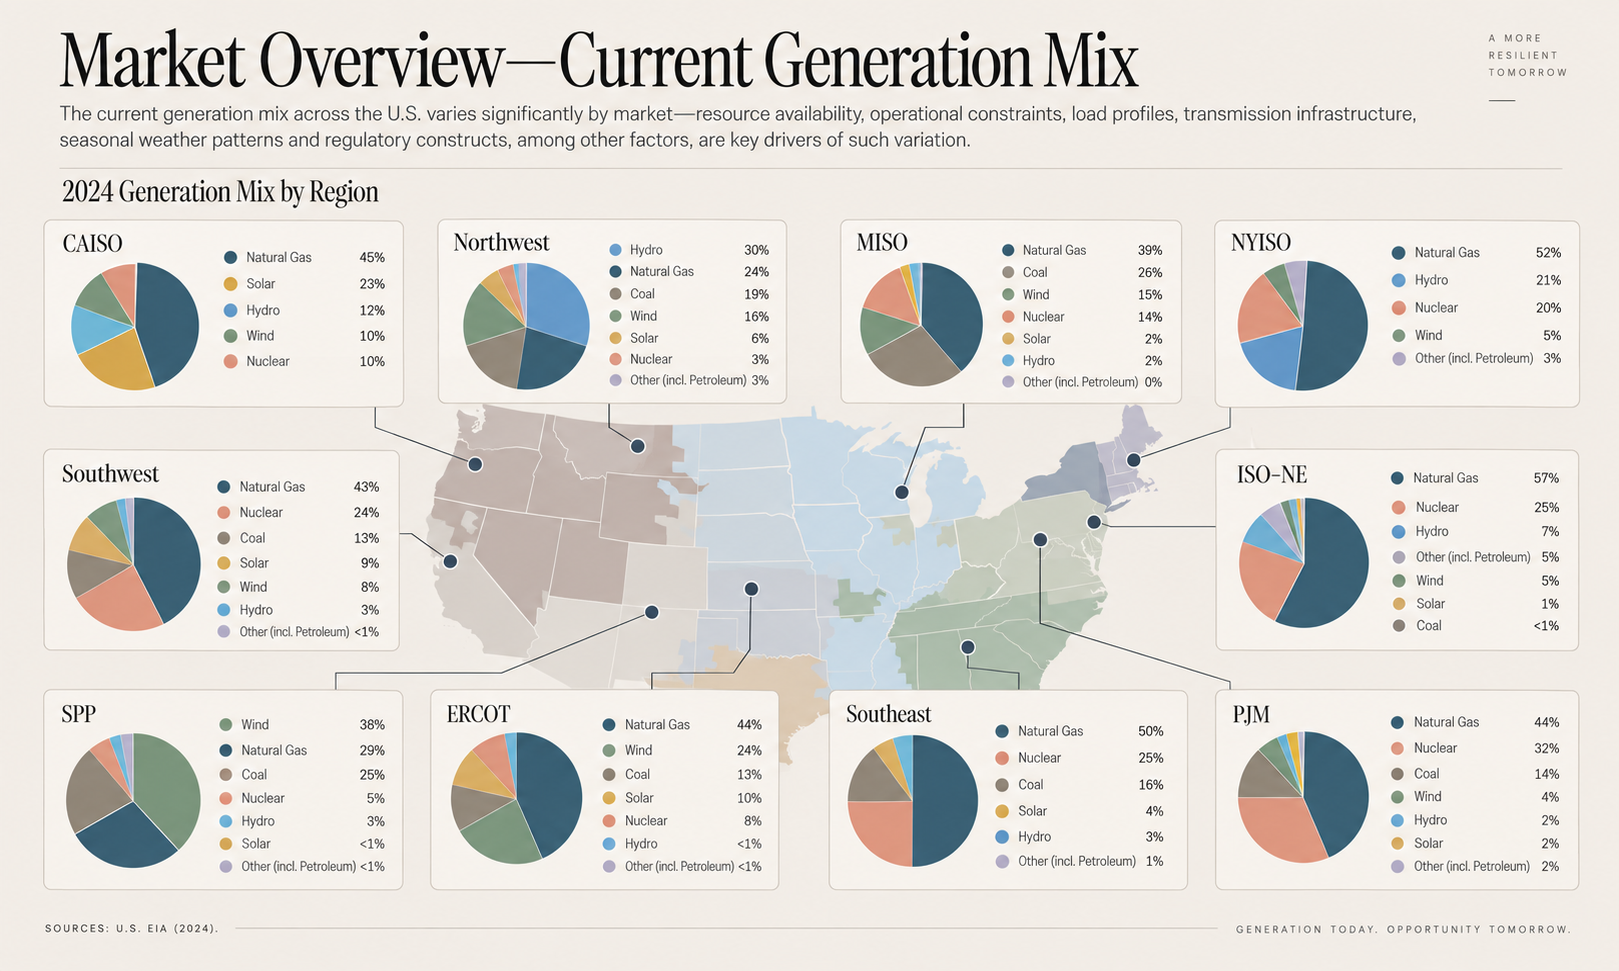
The 1-Month Power Index uses a systematic methodology to provide focused exposure to prompt U.S. electricity markets.
The index holds on-peak futures for the next delivery month across six major U.S. power hubs and rolls each month over business days 1–15.
PJM West — 33.5%
MISO Indiana — 28.7%
ERCOT North — 16.7%
CAISO SP-15 — 9.5%
NYISO Zone G — 6.6%
ISO-NE Mass Hub — 5.0%
Regional weighting is based on three-year average annual electricity consumption, creating diversified exposure across the U.S. power market.
Where applicable, the methodology incorporates carbon-market instruments to support the index’s carbon-neutrality objectives.
ICEPPWRT is the total-return version of the index, combining futures price and roll performance with 3-month T-bill interest earned on collateral.
A Market Becoming Too Important to Ignore
Electricity sits at the center of a rapidly changing economy. Growth in AI, data centers, electrification, manufacturing, and transportation is creating new demand for power—and increasing the relevance of electricity as a distinct commodity market.
❋ AI & Data Centers
The rapid expansion of artificial intelligence and cloud computing is driving substantial growth in electricity-intensive data infrastructure.
❋ Industrial Growth
Manufacturing, infrastructure investment, and domestic industrial expansion are adding new sources of long-term electricity demand.
❋ Electrification
Electric vehicles, residential electrification, and the broader transition toward electric technologies are increasing power consumption across the economy.
❋ A Power-Dependent Economy
As technology becomes increasingly embedded in everyday life and business activity, electricity is becoming an even more fundamental input to economic growth.
Designed for One of the World’s Most Volatile Commodity Markets
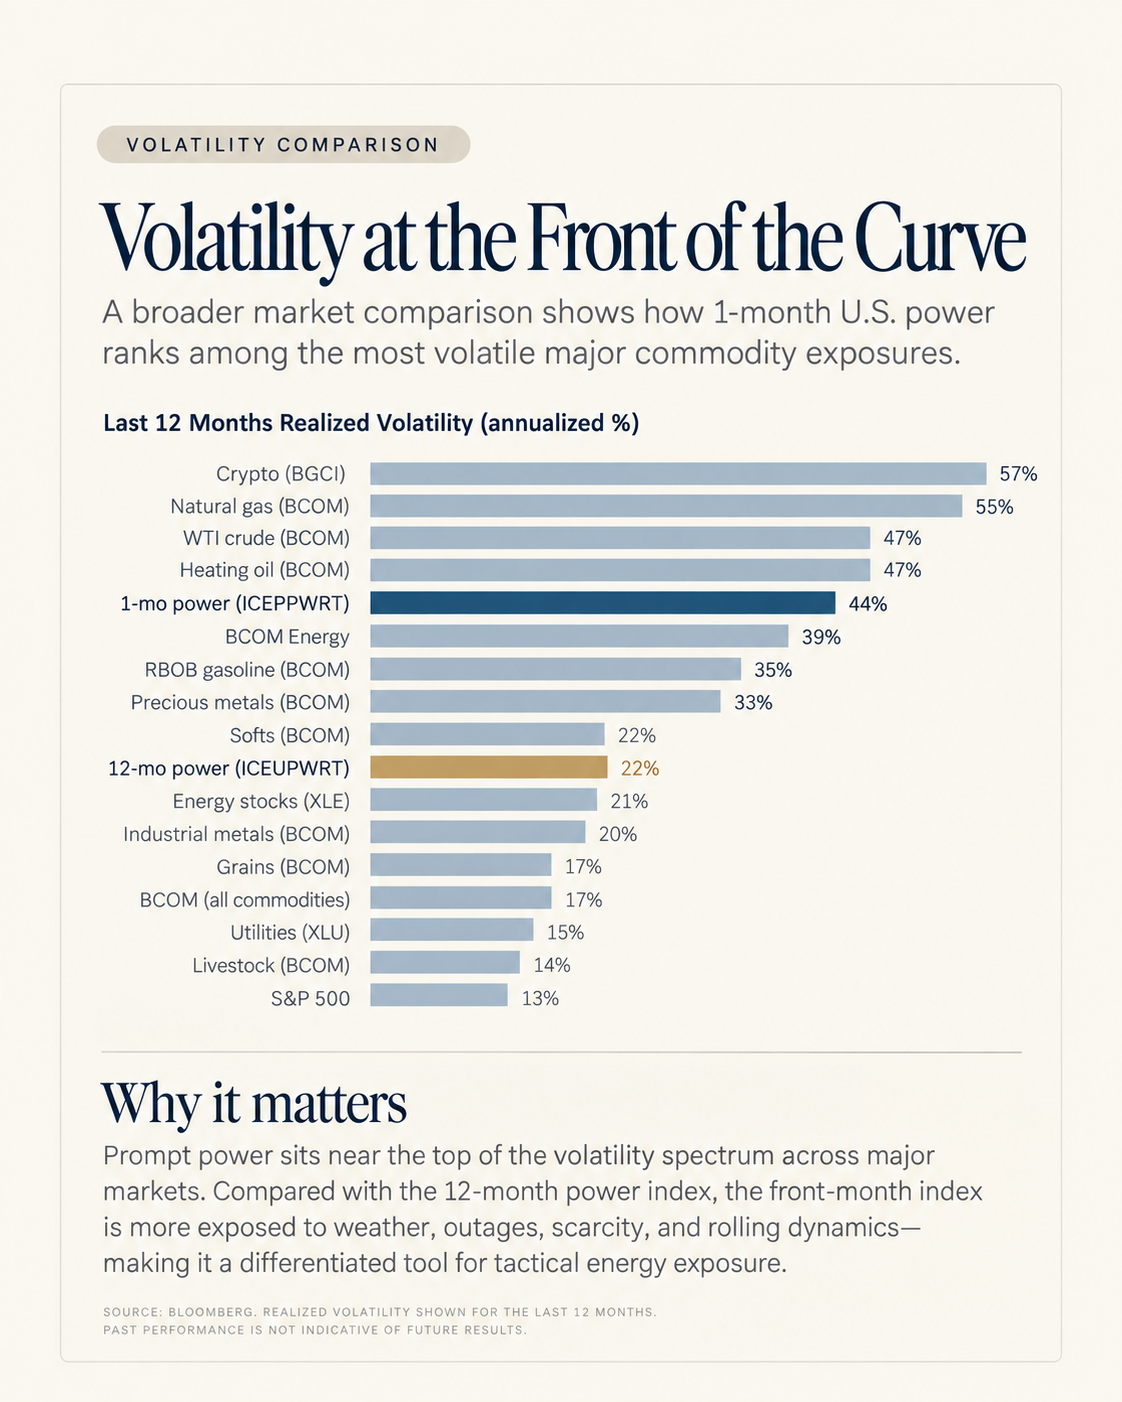
Focused exposure to next-month power allows investors to express short-term long or short views on weather, outages, and scarcity.
Tactical ExposureOne-month power has realized approximately 47% annualized volatility since 2018—nearly twice the 12-month index.
Extreme VolatilityAlthough gas and electricity are closely linked, heat, outages, load, and regional scarcity can cause prompt power to diverge sharply from natural gas.
Natural Gas DecouplingHistorically low correlations to crude oil, broader energy markets, and equities create a differentiated source of market exposure.
Cross-Asset DiversificationBecause the index continuously holds the prompt contract, monthly roll and risk-premium dynamics can materially influence returns.
Monthly Roll DynamicsWeather, seasonal demand, and regional grid constraints create distinct short-term patterns across the power market.
Seasonal & Scarcity PatternsPrompt power exposure can also be used tactically alongside longer-dated power positions to manage front-month risk.
Hedge Overlay