
ICEUPWRT August Index Update
*Transcript:ICEUPWRT · ICE U.S. Electricity Futures Index Monthly Index Update
As of August 31, 2026 Index-level reporting · fund pending launch
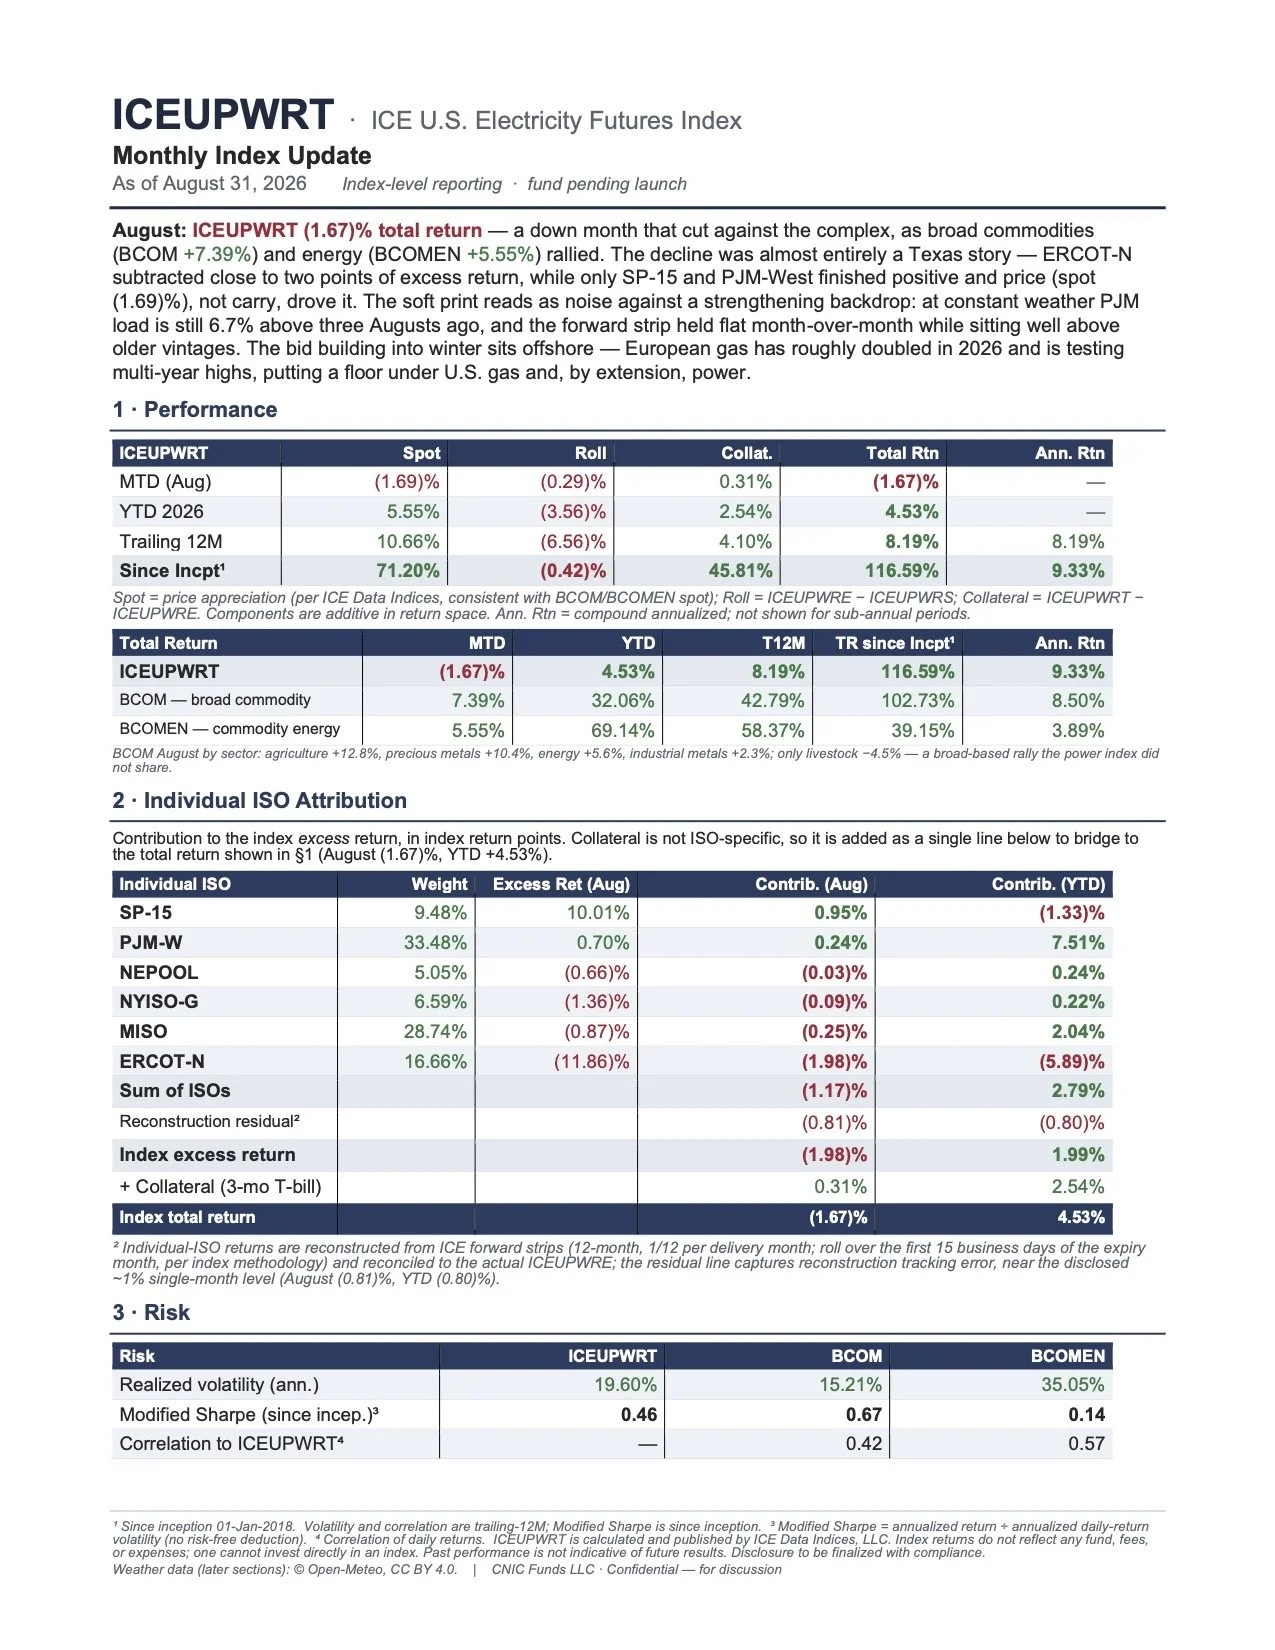
August: ICEUPWRT (1.67)% total return — a down month that cut against the complex, as broad commodities (BCOM +7.39%) and energy (BCOMEN +5.55%) rallied. The decline was almost entirely a Texas story — ERCOT-N subtracted close to two points of excess return, while only SP-15 and PJM-West finished positive and price (spot (1.69)%), not carry, drove it. The soft print reads as noise against a strengthening backdrop: at constant weather PJM load is still 6.7% above three Augusts ago, and the forward strip held flat month-over-month while sitting well above older vintages. The bid building into winter sits offshore — European gas has roughly doubled in 2026 and is testing multi-year highs, putting a floor under U.S. gas and, by extension, power.
1 · Performance
MTD (Aug) (1.69)% (0.29)% 0.31% (1.67)% — Trailing 12M 10.66% (6.56)% 4.10% 8.19% 8.19%
Spot = price appreciation (per ICE Data Indices, consistent with BCOM/BCOMEN spot); Roll = ICEUPWRE − ICEUPWRS; Collateral = ICEUPWRT − ICEUPWRE. Components are additive in return space. Ann. Rtn = compound annualized; not shown for sub-annual periods.
ICEUPWRT
Spot
Roll
Collat.
Total Rtn
Ann. Rtn
YTD 2026
5.55%
(3.56)%
2.54%
4.53%
—
Since Incpt1
71.20%
(0.42)%
45.81%
116.59%
9.33%
Total Return
MTD
YTD
T12M
TR since Incpt1
Ann. Rtn
ICEUPWRT
(1.67)%
4.53%
8.19%
116.59%
9.33%
BCOM — broad commodity
7.39%
32.06%
42.79%
102.73%
8.50%
BCOMEN — commodity energy
5.55% 69.14% 58.37% 39.15% 3.89%
BCOM August by sector: agriculture +12.8%, precious metals +10.4%, energy +5.6%, industrial metals +2.3%; only livestock −4.5% — a broad-based rally the power index did not share.
2 · Individual ISO Attribution
Contribution to the index excess return, in index return points. Collateral is not ISO-specific, so it is added as a single line below to bridge to the total return shown in §1 (August (1.67)%, YTD +4.53%).
Individual ISO
Weight
Excess Ret (Aug)
Contrib. (Aug)
Contrib. (YTD)
SP-15 9.48% 10.01% 0.95% NEPOOL 5.05% (0.66)% (0.03)% MISO 28.74% (0.87)% (0.25)%
Reconstruction residual2 (0.81)% + Collateral (3-mo T-bill) 0.31%
(1.33)%
0.24% 2.04%
(0.80)%
2.54%
PJM-W
33.48%
0.70%
0.24%
7.51%
NYISO-G
6.59%
(1.36)%
(0.09)%
0.22%
ERCOT-N
16.66%
(11.86)%
(1.98)%
(5.89)%
Sum of ISOs
(1.17)%
2.79%
Index excess return
(1.98)%
1.99%
Index total return
(1.67)%
4.53%
2 Individual-ISO returns are reconstructed from ICE forward strips (12-month, 1/12 per delivery month; roll over the first 15 business days of the expiry month, per index methodology) and reconciled to the actual ICEUPWRE; the residual line captures reconstruction tracking error, near the disclosed ~1% single-month level (August (0.81)%, YTD (0.80)%).
3 · Risk
Modified Sharpe (since incep.)3 0.46 0.67 0.14
1 Since inception 01-Jan-2018. Volatility and correlation are trailing-12M; Modified Sharpe is since inception. 3 Modified Sharpe = annualized return ÷ annualized daily-return volatility (no risk-free deduction). 4 Correlation of daily returns. ICEUPWRT is calculated and published by ICE Data Indices, LLC. Index returns do not reflect any fund, fees, or expenses; one cannot invest directly in an index. Past performance is not indicative of future results. Disclosure to be finalized with compliance.
Weather data (later sections): © Open-Meteo, CC BY 4.0. | CNIC Funds LLC · Confidential — for discussion
Risk
ICEUPWRT
BCOM
BCOMEN
Realized volatility (ann.)
19.60%
15.21%
35.05%
Correlation to ICEUPWRT4
—
0.42
0.57
ICEUPWRT · Monthly Index Update · August 31, 2026 4 · Daily Prices & Real-Time Spikes
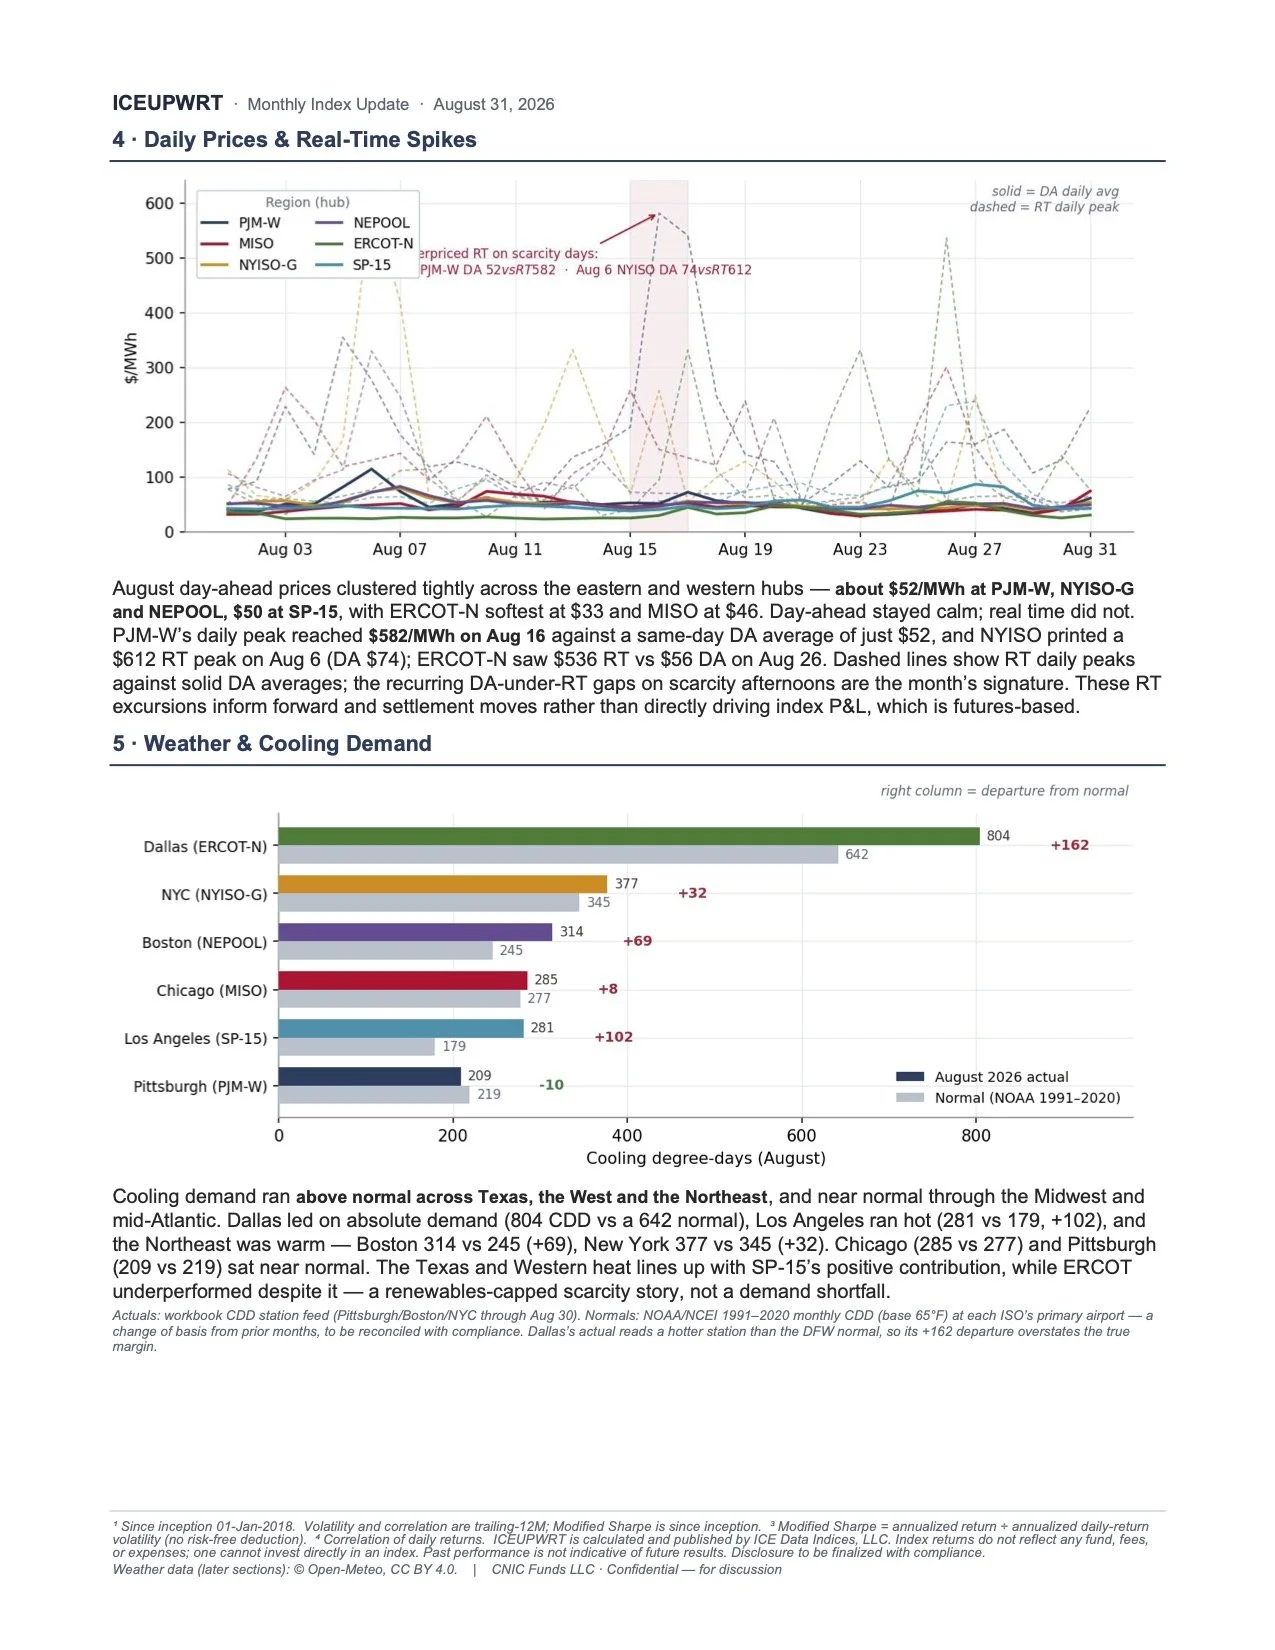
August day-ahead prices clustered tightly across the eastern and western hubs — about $52/MWh at PJM-W, NYISO-G and NEPOOL, $50 at SP-15, with ERCOT-N softest at $33 and MISO at $46. Day-ahead stayed calm; real time did not. PJM-W’s daily peak reached $582/MWh on Aug 16 against a same-day DA average of just $52, and NYISO printed a $612 RT peak on Aug 6 (DA $74); ERCOT-N saw $536 RT vs $56 DA on Aug 26. Dashed lines show RT daily peaks against solid DA averages; the recurring DA-under-RT gaps on scarcity afternoons are the month’s signature. These RT excursions inform forward and settlement moves rather than directly driving index P&L, which is futures-based.
5 · Weather & Cooling Demand
Cooling demand ran above normal across Texas, the West and the Northeast, and near normal through the Midwest and mid-Atlantic. Dallas led on absolute demand (804 CDD vs a 642 normal), Los Angeles ran hot (281 vs 179, +102), and the Northeast was warm — Boston 314 vs 245 (+69), New York 377 vs 345 (+32). Chicago (285 vs 277) and Pittsburgh (209 vs 219) sat near normal. The Texas and Western heat lines up with SP-15’s positive contribution, while ERCOT underperformed despite it — a renewables-capped scarcity story, not a demand shortfall.
Actuals: workbook CDD station feed (Pittsburgh/Boston/NYC through Aug 30). Normals: NOAA/NCEI 1991–2020 monthly CDD (base 65°F) at each ISO’s primary airport — a change of basis from prior months, to be reconciled with compliance. Dallas’s actual reads a hotter station than the DFW normal, so its +162 departure overstates the true margin.
1 Since inception 01-Jan-2018. Volatility and correlation are trailing-12M; Modified Sharpe is since inception. 3 Modified Sharpe = annualized return ÷ annualized daily-return volatility (no risk-free deduction). 4 Correlation of daily returns. ICEUPWRT is calculated and published by ICE Data Indices, LLC. Index returns do not reflect any fund, fees, or expenses; one cannot invest directly in an index. Past performance is not indicative of future results. Disclosure to be finalized with compliance.
Weather data (later sections): © Open-Meteo, CC BY 4.0. | CNIC Funds LLC · Confidential — for discussion
ICEUPWRT · Monthly Index Update · August 31, 2026
6 · Forward Curve & Term-Structure Evolution
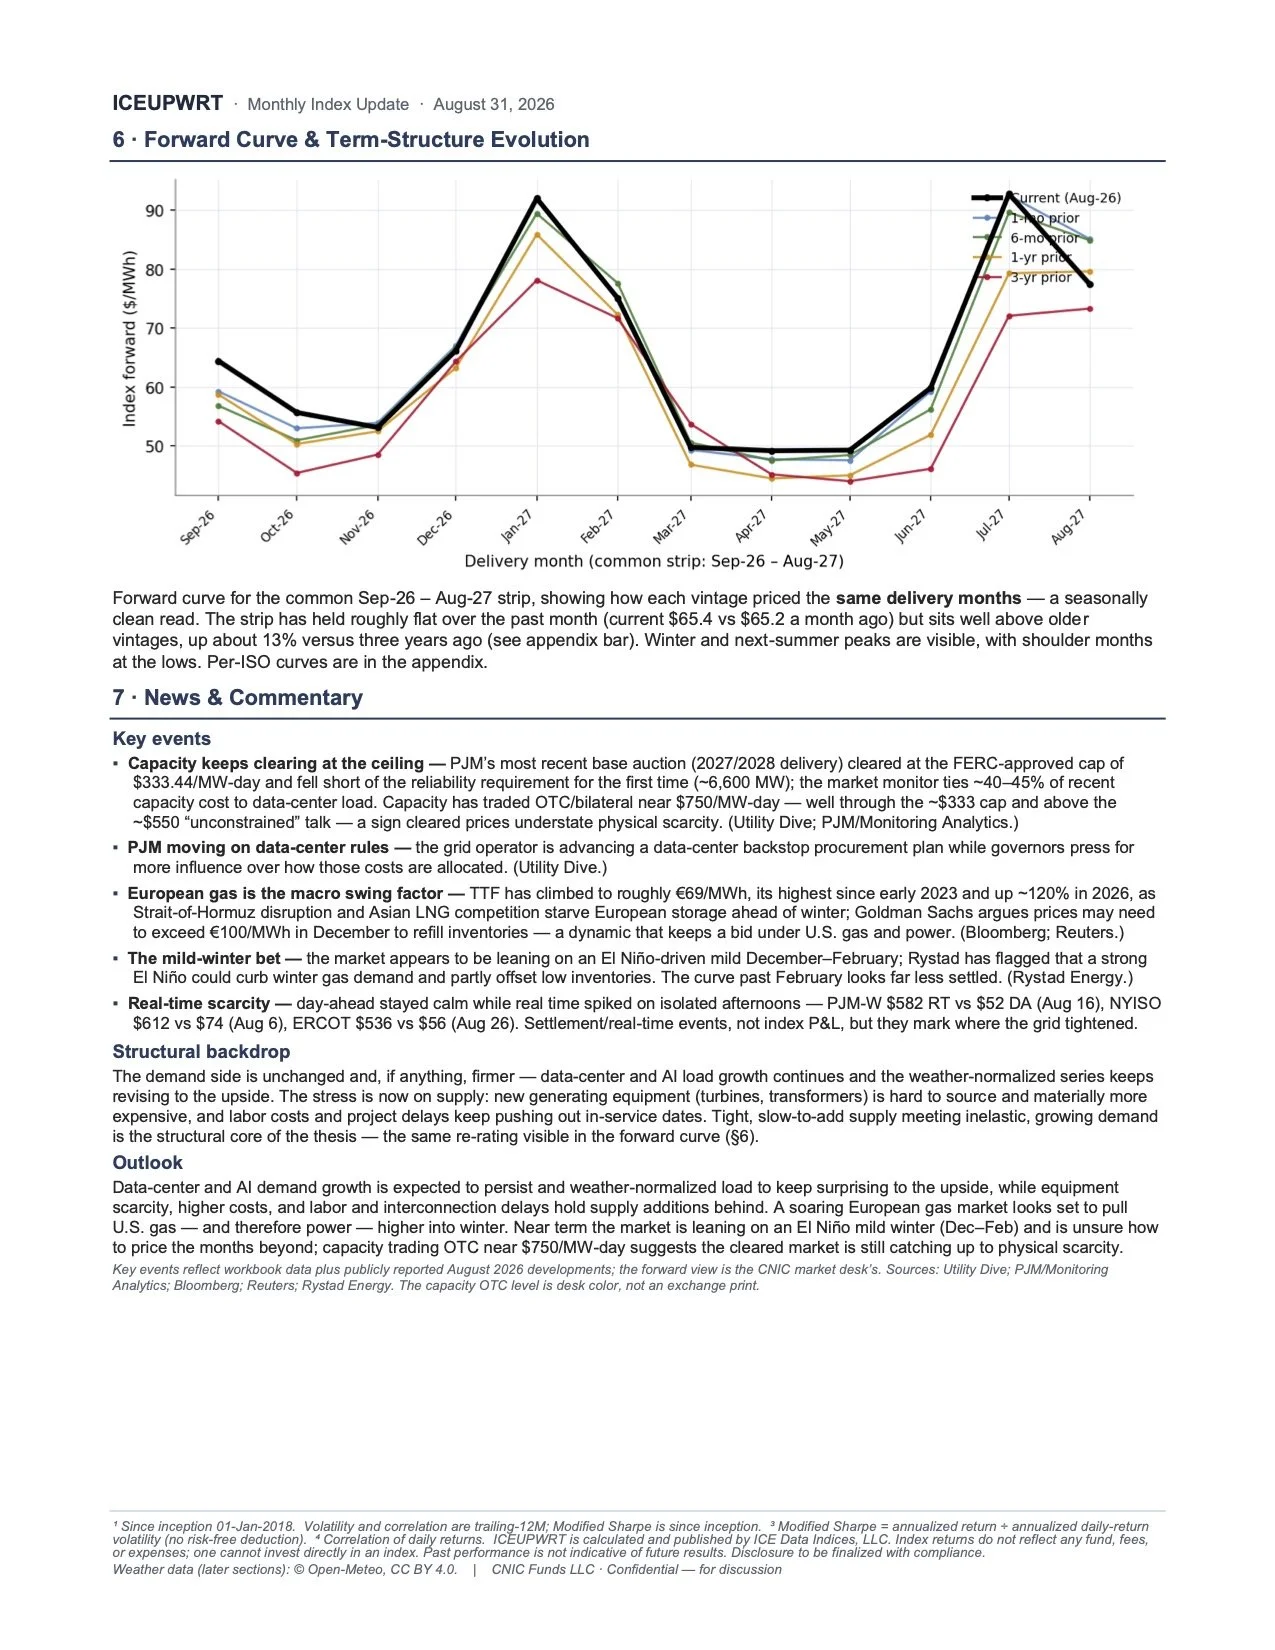
Forward curve for the common Sep-26 – Aug-27 strip, showing how each vintage priced the same delivery months — a seasonally clean read. The strip has held roughly flat over the past month (current $65.4 vs $65.2 a month ago) but sits well above older vintages, up about 13% versus three years ago (see appendix bar). Winter and next-summer peaks are visible, with shoulder months at the lows. Per-ISO curves are in the appendix.
7 · News & Commentary Key events
▪ Capacity keeps clearing at the ceiling — PJM’s most recent base auction (2027/2028 delivery) cleared at the FERC-approved cap of $333.44/MW-day and fell short of the reliability requirement for the first time (~6,600 MW); the market monitor ties ~40–45% of recent capacity cost to data-center load. Capacity has traded OTC/bilateral near $750/MW-day — well through the ~$333 cap and above the ~$550 “unconstrained” talk — a sign cleared prices understate physical scarcity. (Utility Dive; PJM/Monitoring Analytics.)
▪ PJM moving on data-center rules — the grid operator is advancing a data-center backstop procurement plan while governors press for more influence over how those costs are allocated. (Utility Dive.)
▪ European gas is the macro swing factor — TTF has climbed to roughly €69/MWh, its highest since early 2023 and up ~120% in 2026, as Strait-of-Hormuz disruption and Asian LNG competition starve European storage ahead of winter; Goldman Sachs argues prices may need to exceed €100/MWh in December to refill inventories — a dynamic that keeps a bid under U.S. gas and power. (Bloomberg; Reuters.)
▪ The mild-winter bet — the market appears to be leaning on an El Niño-driven mild December–February; Rystad has flagged that a strong El Niño could curb winter gas demand and partly offset low inventories. The curve past February looks far less settled. (Rystad Energy.)
▪ Real-time scarcity — day-ahead stayed calm while real time spiked on isolated afternoons — PJM-W $582 RT vs $52 DA (Aug 16), NYISO $612 vs $74 (Aug 6), ERCOT $536 vs $56 (Aug 26). Settlement/real-time events, not index P&L, but they mark where the grid tightened.
Structural backdrop
The demand side is unchanged and, if anything, firmer — data-center and AI load growth continues and the weather-normalized series keeps revising to the upside. The stress is now on supply: new generating equipment (turbines, transformers) is hard to source and materially more expensive, and labor costs and project delays keep pushing out in-service dates. Tight, slow-to-add supply meeting inelastic, growing demand is the structural core of the thesis — the same re-rating visible in the forward curve (§6).
Outlook
Data-center and AI demand growth is expected to persist and weather-normalized load to keep surprising to the upside, while equipment
scarcity, higher costs, and labor and interconnection delays hold supply additions behind. A soaring European gas market looks set to pull
U.S. gas — and therefore power — higher into winter. Near term the market is leaning on an El Niño mild winter (Dec–Feb) and is unsure how
to price the months beyond; capacity trading OTC near $750/MW-day suggests the cleared market is still catching up to physical scarcity.
Key events reflect workbook data plus publicly reported August 2026 developments; the forward view is the CNIC market desk’s. Sources: Utility Dive; PJM/Monitoring Analytics; Bloomberg; Reuters; Rystad Energy. The capacity OTC level is desk color, not an exchange print.
1 Since inception 01-Jan-2018. Volatility and correlation are trailing-12M; Modified Sharpe is since inception. 3 Modified Sharpe = annualized return ÷ annualized daily-return volatility (no risk-free deduction). 4 Correlation of daily returns. ICEUPWRT is calculated and published by ICE Data Indices, LLC. Index returns do not reflect any fund, fees, or expenses; one cannot invest directly in an index. Past performance is not indicative of future results. Disclosure to be finalized with compliance.
Weather data (later sections): © Open-Meteo, CC BY 4.0. | CNIC Funds LLC · Confidential — for discussion
ICEUPWRT · Monthly Index Update · August 31, 2026
8 · Weather-Normalized Load & Price
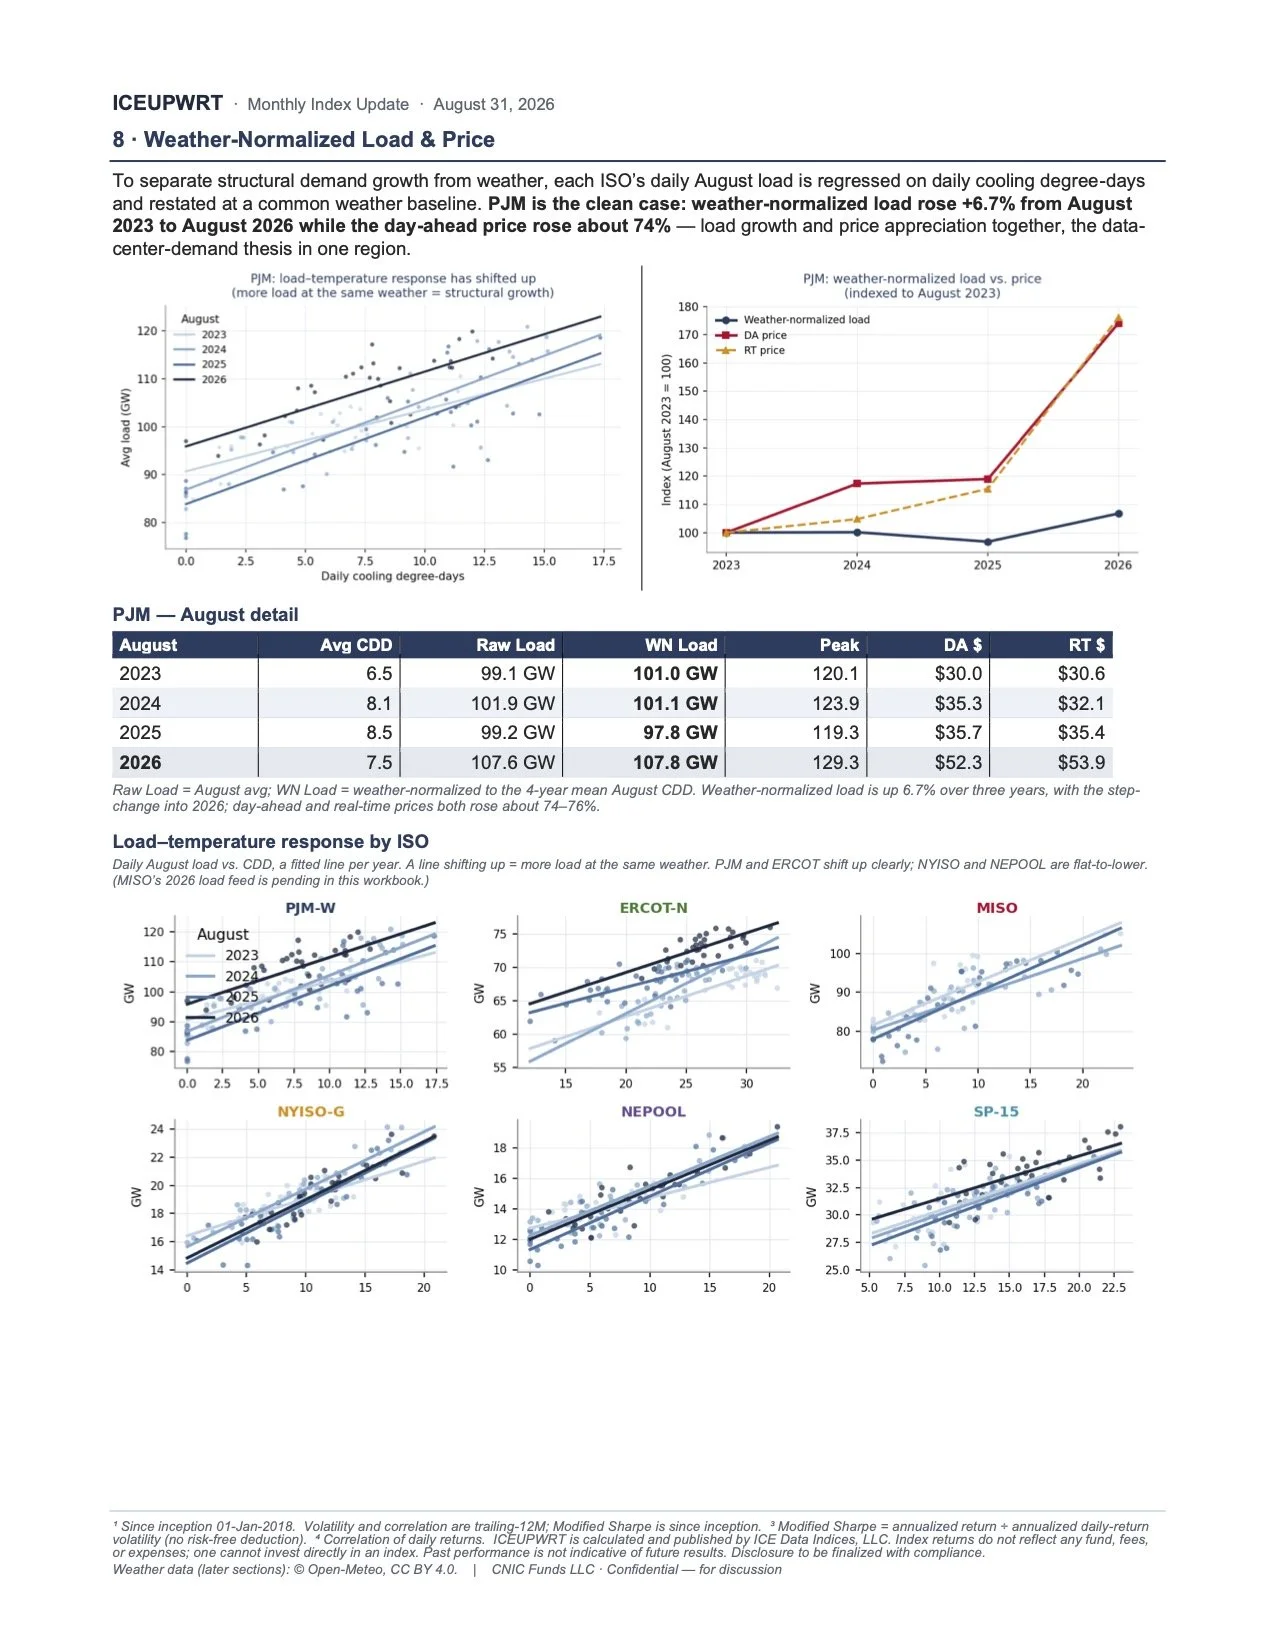
To separate structural demand growth from weather, each ISO’s daily August load is regressed on daily cooling degree-days and restated at a common weather baseline. PJM is the clean case: weather-normalized load rose +6.7% from August 2023 to August 2026 while the day-ahead price rose about 74% — load growth and price appreciation together, the data- center-demand thesis in one region.
PJM — August detail
2023 6.5 99.1 GW 101.0 GW 120.1 $30.0 $30.6 2025 8.5 99.2 GW 97.8 GW 119.3 $35.7 $35.4
Raw Load = August avg; WN Load = weather-normalized to the 4-year mean August CDD. Weather-normalized load is up 6.7% over three years, with the step- change into 2026; day-ahead and real-time prices both rose about 74–76%.
Load–temperature response by ISO
Daily August load vs. CDD, a fitted line per year. A line shifting up = more load at the same weather. PJM and ERCOT shift up clearly; NYISO and NEPOOL are flat-to-lower. (MISO’s 2026 load feed is pending in this workbook.)
August
Avg CDD
Raw Load
WN Load
Peak
DA $
RT $
2024
8.1
101.9 GW
101.1 GW
123.9
$35.3
$32.1
2026
7.5
107.6 GW
107.8 GW
129.3
$52.3
$53.9
1 Since inception 01-Jan-2018. Volatility and correlation are trailing-12M; Modified Sharpe is since inception. 3 Modified Sharpe = annualized return ÷ annualized daily-return volatility (no risk-free deduction). 4 Correlation of daily returns. ICEUPWRT is calculated and published by ICE Data Indices, LLC. Index returns do not reflect any fund, fees, or expenses; one cannot invest directly in an index. Past performance is not indicative of future results. Disclosure to be finalized with compliance.
Weather data (later sections): © Open-Meteo, CC BY 4.0. | CNIC Funds LLC · Confidential — for discussion
Cross-ISO summary
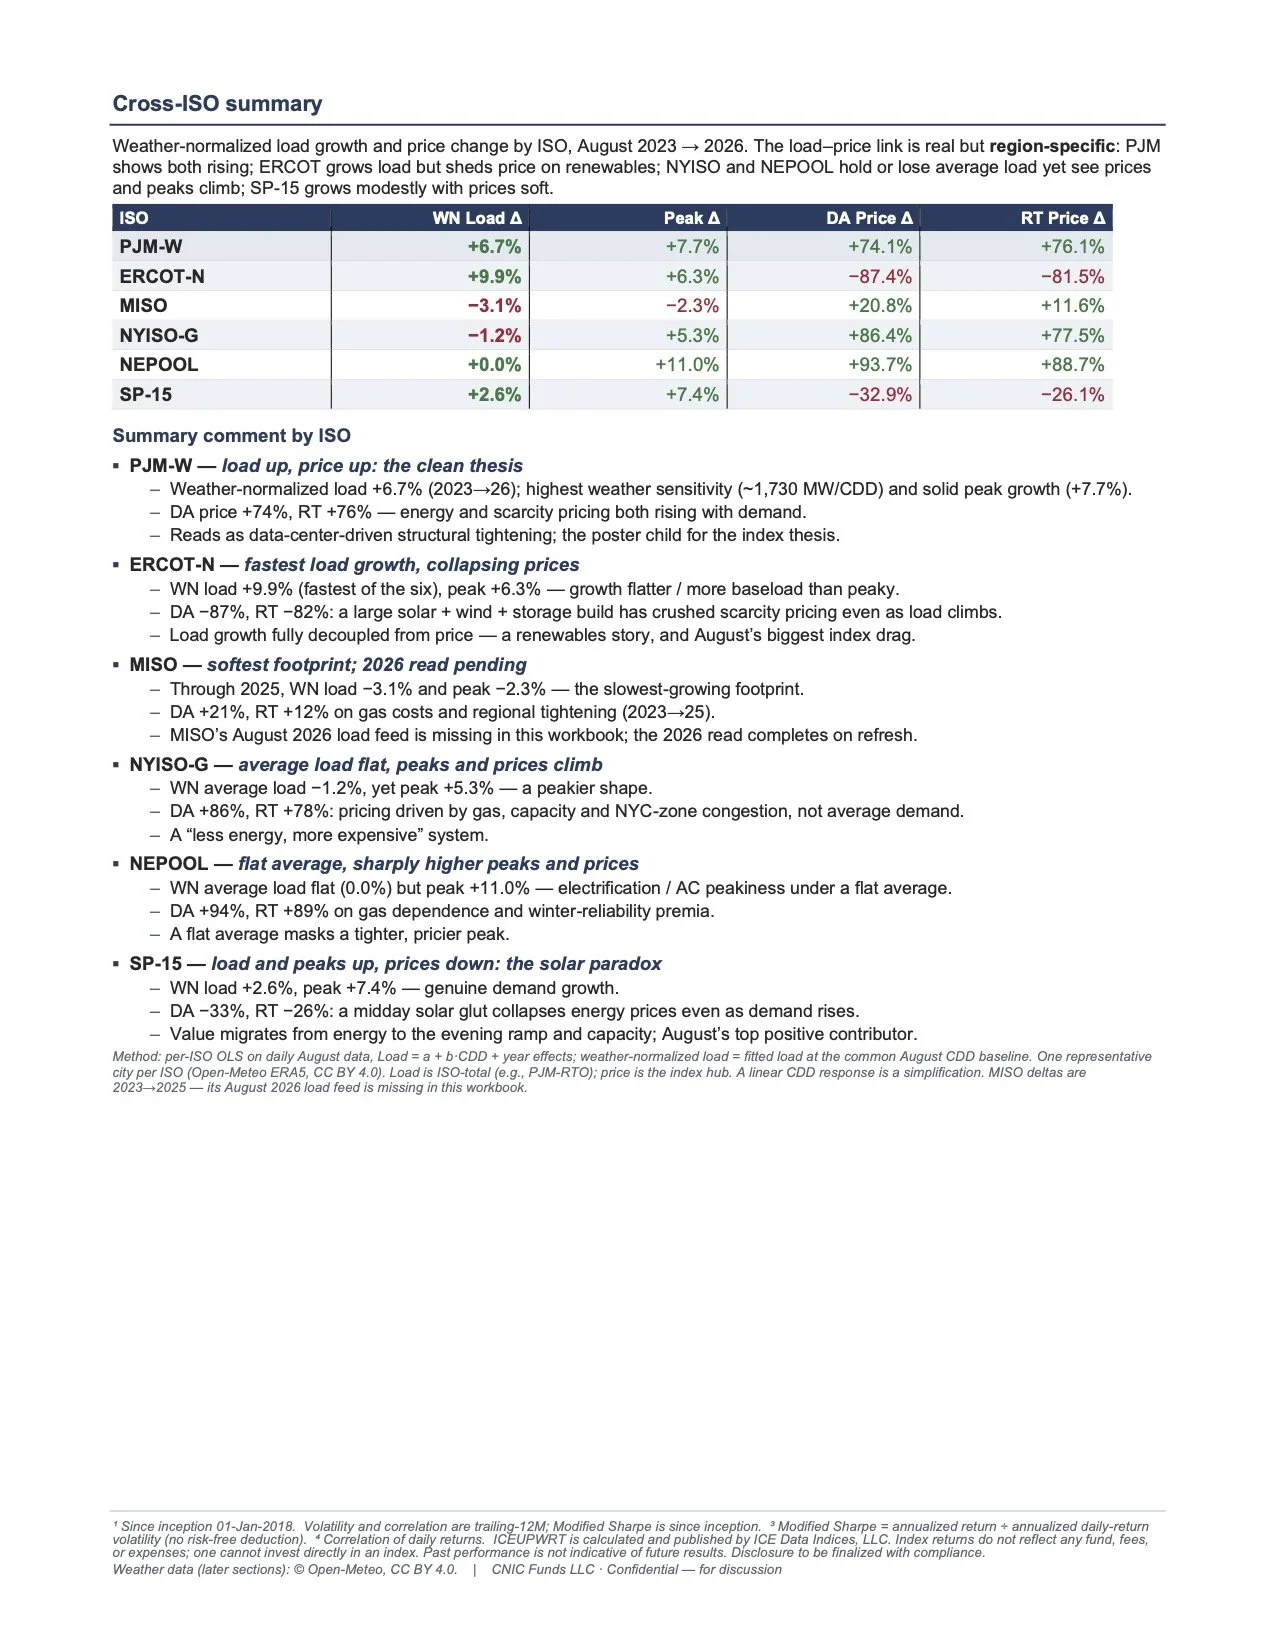
Weather-normalized load growth and price change by ISO, August 2023 → 2026. The load–price link is real but region-specific: PJM shows both rising; ERCOT grows load but sheds price on renewables; NYISO and NEPOOL hold or lose average load yet see prices and peaks climb; SP-15 grows modestly with prices soft.
MISO −3.1% −2.3% +20.8% +11.6% NEPOOL +0.0% +11.0% +93.7% +88.7%
Summary comment by ISO
▪ PJM-W — load up, price up: the clean thesis
– Weather-normalized load +6.7% (2023→26); highest weather sensitivity (~1,730 MW/CDD) and solid peak growth (+7.7%). – DA price +74%, RT +76% — energy and scarcity pricing both rising with demand.
– Reads as data-center-driven structural tightening; the poster child for the index thesis.
▪ ERCOT-N — fastest load growth, collapsing prices
– WN load +9.9% (fastest of the six), peak +6.3% — growth flatter / more baseload than peaky.
– DA −87%, RT −82%: a large solar + wind + storage build has crushed scarcity pricing even as load climbs. – Load growth fully decoupled from price — a renewables story, and August’s biggest index drag.
▪ MISO — softest footprint; 2026 read pending
– Through 2025, WN load −3.1% and peak −2.3% — the slowest-growing footprint.
– DA +21%, RT +12% on gas costs and regional tightening (2023→25).
– MISO’s August 2026 load feed is missing in this workbook; the 2026 read completes on refresh.
▪ NYISO-G — average load flat, peaks and prices climb
– WN average load −1.2%, yet peak +5.3% — a peakier shape.
– DA +86%, RT +78%: pricing driven by gas, capacity and NYC-zone congestion, not average demand. – A “less energy, more expensive” system.
▪ NEPOOL — flat average, sharply higher peaks and prices
– WN average load flat (0.0%) but peak +11.0% — electrification / AC peakiness under a flat average. – DA +94%, RT +89% on gas dependence and winter-reliability premia.
– A flat average masks a tighter, pricier peak.
▪ SP-15 — load and peaks up, prices down: the solar paradox
– WN load +2.6%, peak +7.4% — genuine demand growth.
– DA −33%, RT −26%: a midday solar glut collapses energy prices even as demand rises.
– Value migrates from energy to the evening ramp and capacity; August’s top positive contributor.
Method: per-ISO OLS on daily August data, Load = a + b·CDD + year effects; weather-normalized load = fitted load at the common August CDD baseline. One representative city per ISO (Open-Meteo ERA5, CC BY 4.0). Load is ISO-total (e.g., PJM-RTO); price is the index hub. A linear CDD response is a simplification. MISO deltas are 2023→2025 — its August 2026 load feed is missing in this workbook.
ISO
WN Load Δ
Peak Δ
DA Price Δ
RT Price Δ
PJM-W
+6.7%
+7.7%
+74.1%
+76.1%
ERCOT-N
+9.9%
+6.3%
−87.4%
−81.5%
NYISO-G
−1.2%
+5.3%
+86.4%
+77.5%
SP-15
+2.6%
+7.4%
−32.9%
−26.1%
1 Since inception 01-Jan-2018. Volatility and correlation are trailing-12M; Modified Sharpe is since inception. 3 Modified Sharpe = annualized return ÷ annualized daily-return volatility (no risk-free deduction). 4 Correlation of daily returns. ICEUPWRT is calculated and published by ICE Data Indices, LLC. Index returns do not reflect any fund, fees, or expenses; one cannot invest directly in an index. Past performance is not indicative of future results. Disclosure to be finalized with compliance.
Weather data (later sections): © Open-Meteo, CC BY 4.0. | CNIC Funds LLC · Confidential — for discussion
ICEUPWRT · Appendix · August 31, 2026 Appendix · Per-ISO Term Structure
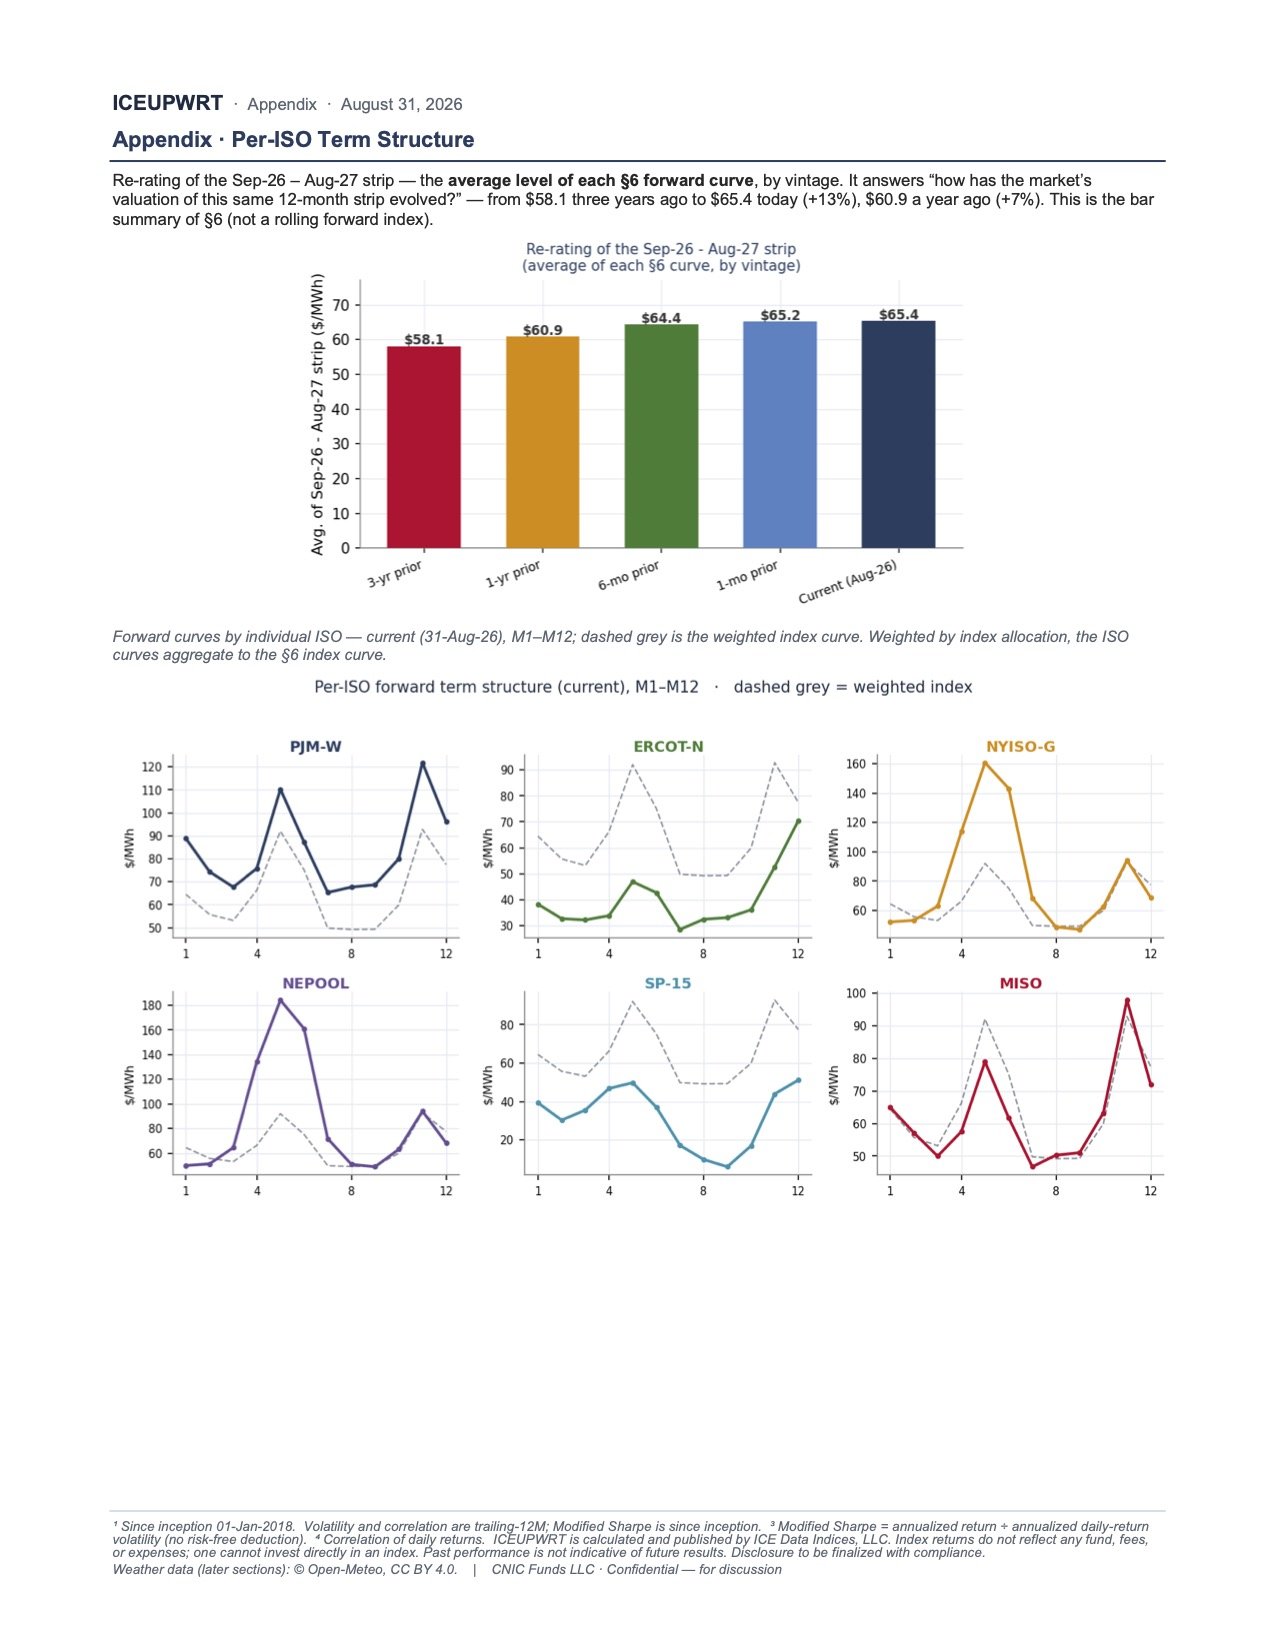
Re-rating of the Sep-26 – Aug-27 strip — the average level of each §6 forward curve, by vintage. It answers “how has the market’s valuation of this same 12-month strip evolved?” — from $58.1 three years ago to $65.4 today (+13%), $60.9 a year ago (+7%). This is the bar summary of §6 (not a rolling forward index).
Forward curves by individual ISO — current (31-Aug-26), M1–M12; dashed grey is the weighted index curve. Weighted by index allocation, the ISO curves aggregate to the §6 index curve.
1 Since inception 01-Jan-2018. Volatility and correlation are trailing-12M; Modified Sharpe is since inception. 3 Modified Sharpe = annualized return ÷ annualized daily-return volatility (no risk-free deduction). 4 Correlation of daily returns. ICEUPWRT is calculated and published by ICE Data Indices, LLC. Index returns do not reflect any fund, fees, or expenses; one cannot invest directly in an index. Past performance is not indicative of future results. Disclosure to be finalized with compliance.
Weather data (later sections): © Open-Meteo, CC BY 4.0. | CNIC Funds LLC · Confidential — for discussion
