
US Power and the 2027 El Niño Summer
*TRANSCRIPT:KRAMERICA · THESIS PAPER
US Power and the 2027 El Niño Summer
The grid got 6.5 times more sensitive to heat, and power has stopped following gas. The curve has noticed neither.
v16 · markets as of 31 August 2026 · ENSO as of the 13 August 2026 CPC discussion
Summary
Long July 2027 and August 2027 PJM Western Hub on-peak power, as co-equal legs, entered at $115.50 and $92.05 for a strip of $103.78. Three independent findings support the position, and each is measured monthly against what the market actually does.
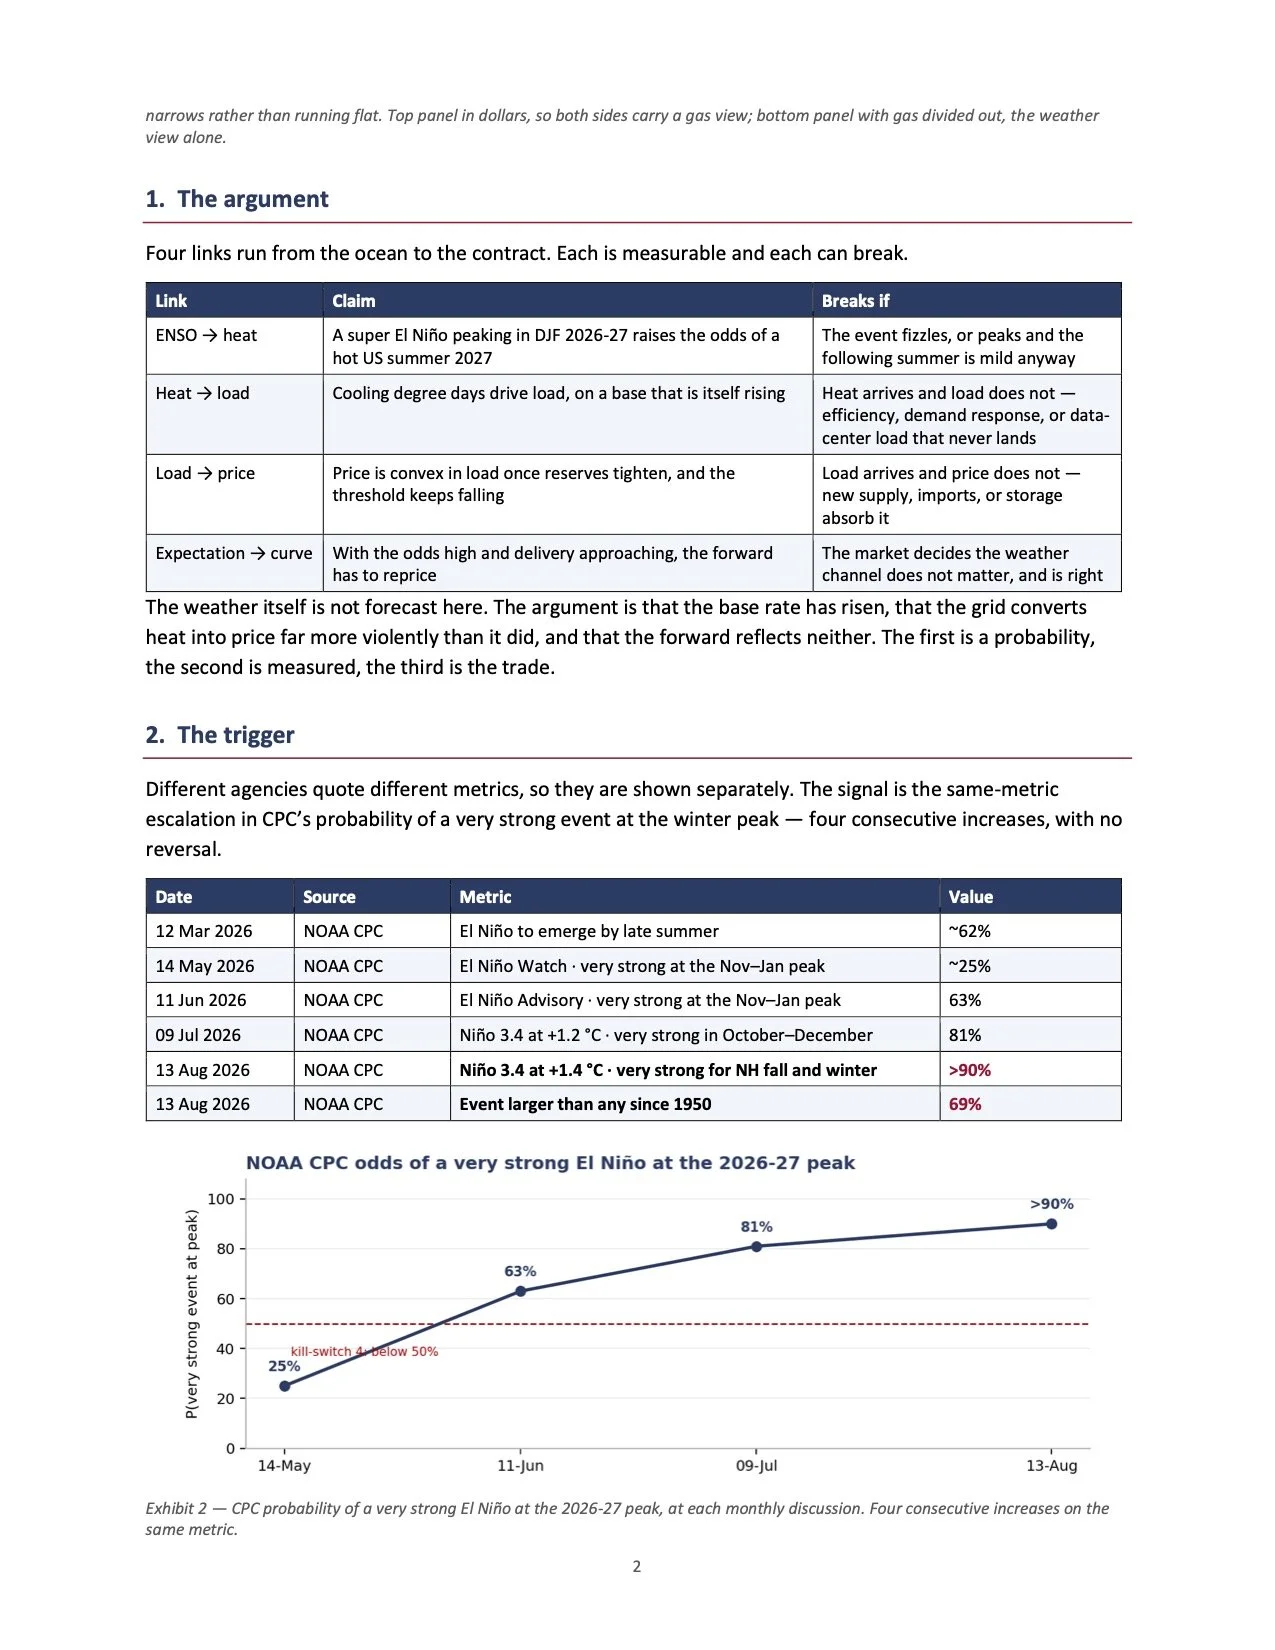
A super El Niño is building, and CPC has raised the odds at four consecutive issues. 25% in May, 63% in June, 81% in July, >90% in August, with a 69% chance of an event larger than any since 1950. The summers after the last two super-El Niño peaks were the hottest years on record at the time.
PJM converts heat into price 6.5 times more violently than in 2022, and power has begun trading free of gas. The response per cooling degree day has risen from 0.79 to 5.13 on a lower base, while the 30- day power-gas correlation fell to 0.08 and power now takes 1.75× of a gas rally but only 0.50× of a selloff.
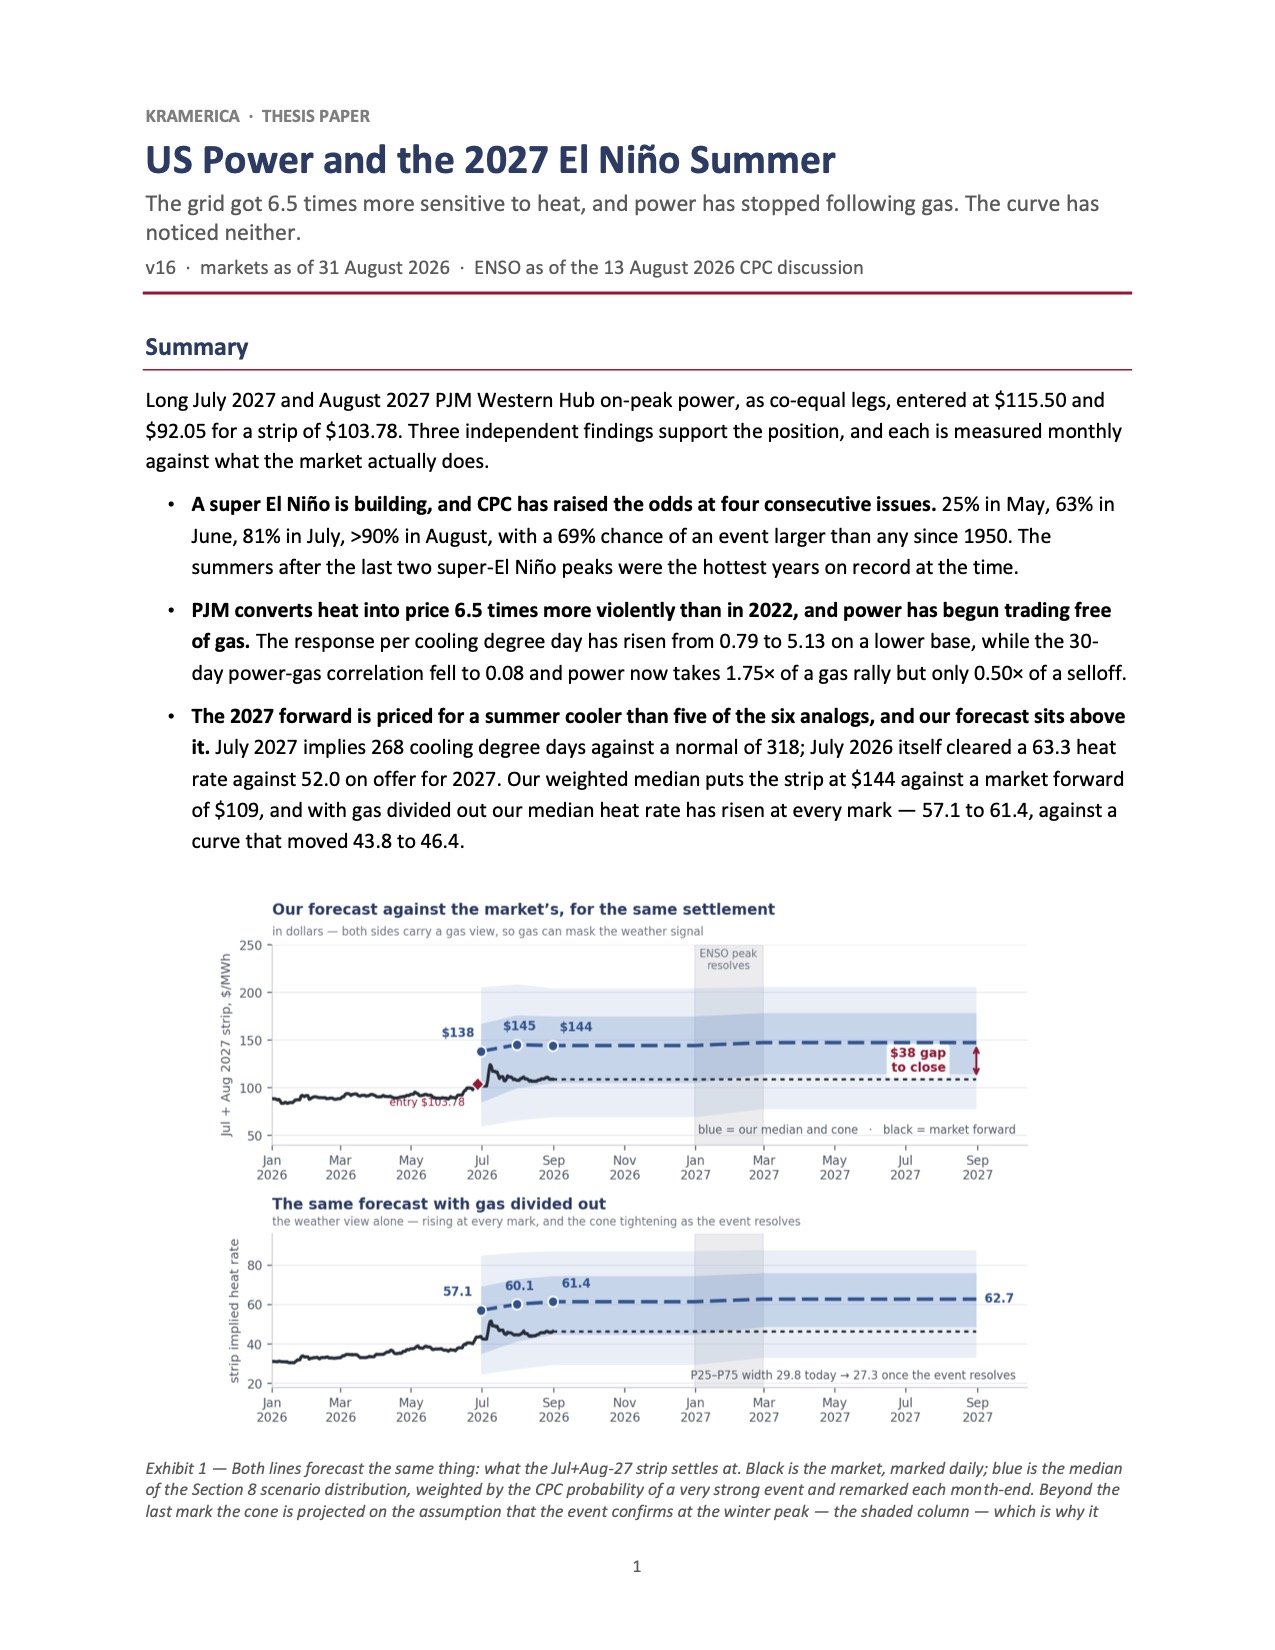
The 2027 forward is priced for a summer cooler than five of the six analogs, and our forecast sits above it. July 2027 implies 268 cooling degree days against a normal of 318; July 2026 itself cleared a 63.3 heat rate against 52.0 on offer for 2027. Our weighted median puts the strip at $144 against a market forward of $109, and with gas divided out our median heat rate has risen at every mark — 57.1 to 61.4, against a curve that moved 43.8 to 46.4.
Exhibit 1 — Both lines forecast the same thing: what the Jul+Aug-27 strip settles at. Black is the market, marked daily; blue is the median of the Section 8 scenario distribution, weighted by the CPC probability of a very strong event and remarked each month-end. Beyond the last mark the cone is projected on the assumption that the event confirms at the winter peak — the shaded column — which is why it
1
narrows rather than running flat. Top panel in dollars, so both sides carry a gas view; bottom panel with gas divided out, the weather view alone.
1. The argument
Four links run from the ocean to the contract. Each is measurable and each can break.
Link
Claim
Breaks if
ENSO → heat A super El Niño peaking in DJF 2026-27 raises the odds of a hot US summer 2027
Load → price Price is convex in load once reserves tighten, and the threshold keeps falling
The event fizzles, or peaks and the following summer is mild anyway
Load arrives and price does not — new supply, imports, or storage absorb it
Heat → load
Cooling degree days drive load, on a base that is itself rising
Heat arrives and load does not — efficiency, demand response, or data- center load that never lands
Expectation → curve
With the odds high and delivery approaching, the forward has to reprice
The market decides the weather channel does not matter, and is right
The weather itself is not forecast here. The argument is that the base rate has risen, that the grid converts heat into price far more violently than it did, and that the forward reflects neither. The first is a probability, the second is measured, the third is the trade.
2. The trigger
Different agencies quote different metrics, so they are shown separately. The signal is the same-metric escalation in CPC’s probability of a very strong event at the winter peak — four consecutive increases, with no reversal.
Date
Source
Metric
Value
12 Mar 2026 11 Jun 2026 13 Aug 2026
NOAA CPC NOAA CPC NOAA CPC
El Niño to emerge by late summer ~62% El Niño Advisory · very strong at the Nov–Jan peak 63% Niño 3.4 at +1.4 °C · very strong for NH fall and winter >90%
14 May 2026
NOAA CPC
El Niño Watch · very strong at the Nov–Jan peak
~25%
09 Jul 2026
NOAA CPC
Niño 3.4 at +1.2 °C · very strong in October–December
81%
13 Aug 2026
NOAA CPC
Event larger than any since 1950
69%
Exhibit 2 — CPC probability of a very strong El Niño at the 2026-27 peak, at each monthly discussion. Four consecutive increases on the same metric.
2
The route to a hot summer 2027 is not a direct teleconnection — the El Niño signal is strongest in winter. It is the lagged release of tropical Pacific heat that makes the year after a super-event peak a leading candidate for the warmest on record, reinforced by the decay toward neutral or La Niña, which favors mid-latitude ridging. That pattern held after 1997-98 and after 2015-16.
3. What the grid delivered in 2026
June 2026 set a record on-peak heat rate for the month on unremarkable cooling demand. July did not give it back. August then cooled off completely — which is itself informative, and is dealt with below.
PJM-W on-peak, 5×16
Jul 2023
Jul 2024
Jul 2025
Jun 2026
Jul 2026
Aug 2026
Average price ($/MWh)
Median day ($/MWh)
High day ($/MWh)
On-peak days in month
47.82 65.80 41 56 83 122
20 22
77.36 83.84 135.34 70.73 66 57 75 64 142 288 482 148
22 22 23 21
Implied heat rate
32.8
47.8
29.6
36.5
63.3
40.0
90th-percentile day ($/MWh)
68
117
137
120
332
119
Days above $150 / $300
0/0
0/0
0/0
2/0
5 /4
0/0
All heat rates are struck on Dominion South, the gas PJM-West generators actually burn. Earlier drafts quoted the 2023–2025 Julys on Henry Hub alongside a Dominion South 2026, which understated the earlier years; the series above is on one basis throughout.
The median July day cleared $75 and the ninetieth-percentile day cleared $332. A monthly contract settles as the average of that distribution, so a handful of days carry the month — convexity that costs nothing to own. August is the counter-example and worth stating plainly: 0 days above $150, a high of $148, and a heat rate of 40.0. The tail is where the value sits, and the tail does not arrive every month.
The price-load curve
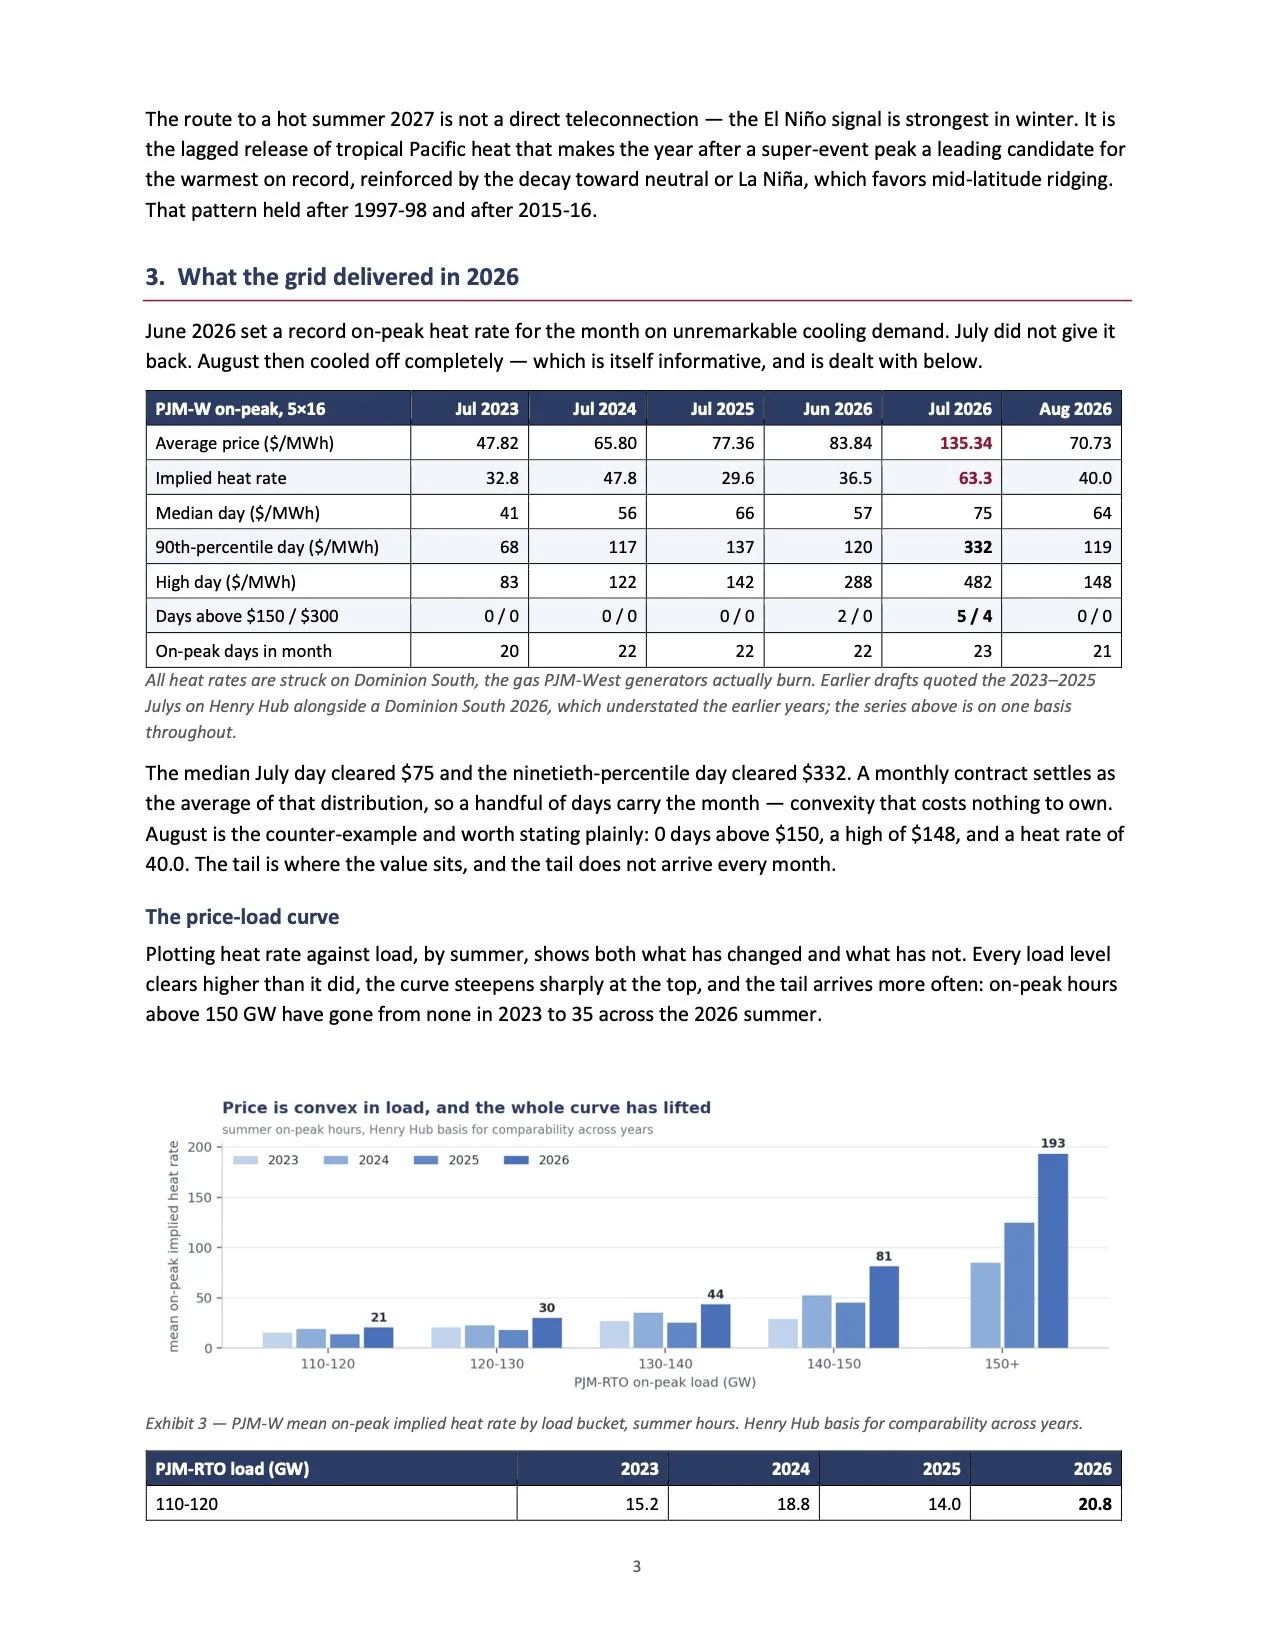
Plotting heat rate against load, by summer, shows both what has changed and what has not. Every load level clears higher than it did, the curve steepens sharply at the top, and the tail arrives more often: on-peak hours above 150 GW have gone from none in 2023 to 35 across the 2026 summer.
Exhibit 3 — PJM-W mean on-peak implied heat rate by load bucket, summer hours. Henry Hub basis for comparability across years.
110-120 15.2 18.8 14.0 20.8 3
PJM-RTO load (GW)
2023
2024
2025
2026
PJM-RTO load (GW)
2023
2024
2025
2026
120-130
20.4
22.6
17.8
30.0
130-140 26.7 35.2 25.3 43.5 150+ — 84.7 124.6 193.4
4. How much heat is worth now
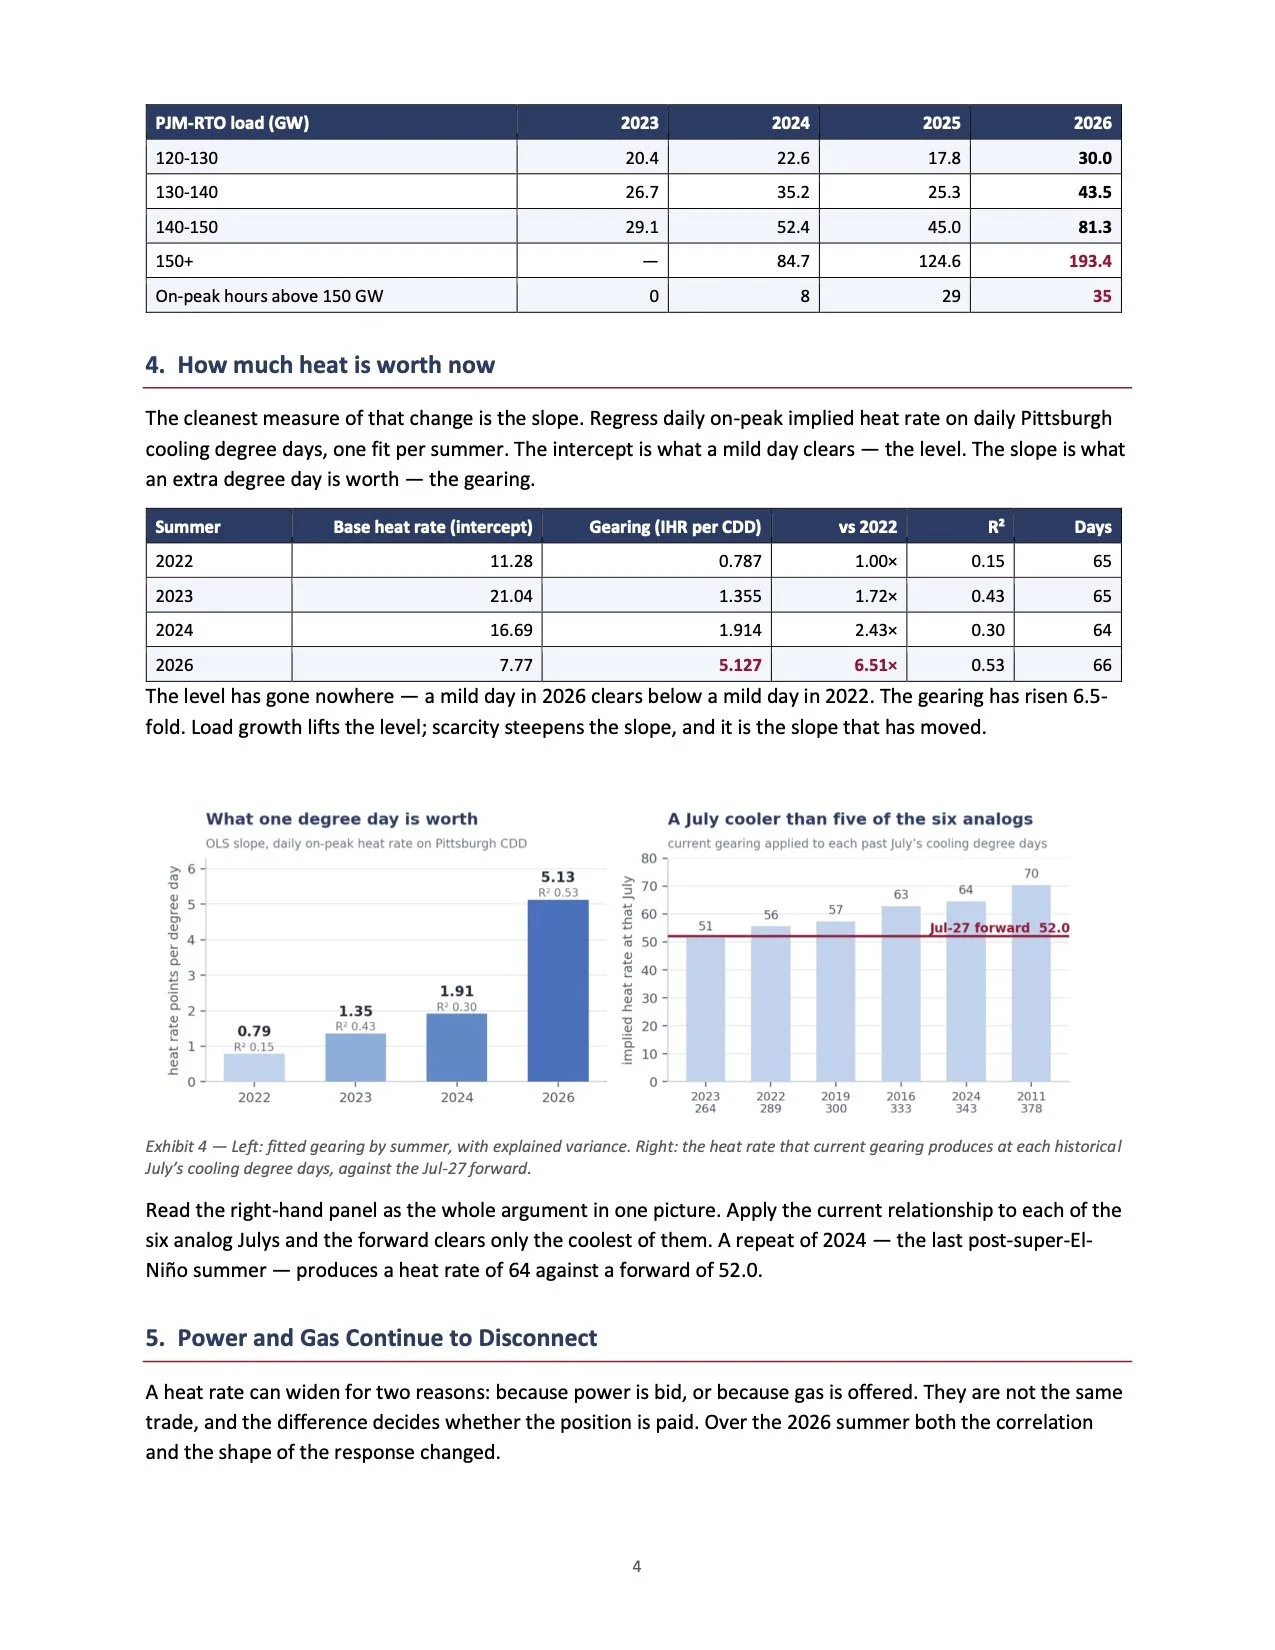
The cleanest measure of that change is the slope. Regress daily on-peak implied heat rate on daily Pittsburgh cooling degree days, one fit per summer. The intercept is what a mild day clears — the level. The slope is what an extra degree day is worth — the gearing.
2022 11.28 0.787 1.00× 0.15 65
2024 16.69 1.914 2.43× 0.30 64
The level has gone nowhere — a mild day in 2026 clears below a mild day in 2022. The gearing has risen 6.5- fold. Load growth lifts the level; scarcity steepens the slope, and it is the slope that has moved.
Exhibit 4 — Left: fitted gearing by summer, with explained variance. Right: the heat rate that current gearing produces at each historical July’s cooling degree days, against the Jul-27 forward.
Read the right-hand panel as the whole argument in one picture. Apply the current relationship to each of the six analog Julys and the forward clears only the coolest of them. A repeat of 2024 — the last post-super-El- Niño summer — produces a heat rate of 64 against a forward of 52.0.
5. Power and Gas Continue to Disconnect
A heat rate can widen for two reasons: because power is bid, or because gas is offered. They are not the same trade, and the difference decides whether the position is paid. Over the 2026 summer both the correlation and the shape of the response changed.
140-150
29.1
52.4
45.0
81.3
On-peak hours above 150 GW
0
8
29
35
Summer
Base heat rate (intercept)
Gearing (IHR per CDD)
vs 2022
R2
Days
2023
21.04
1.355
1.72×
0.43
65
2026
7.77
5.127
6.51×
0.53
66
4
Measure
Jan–May 2026
Jun–Aug 2026
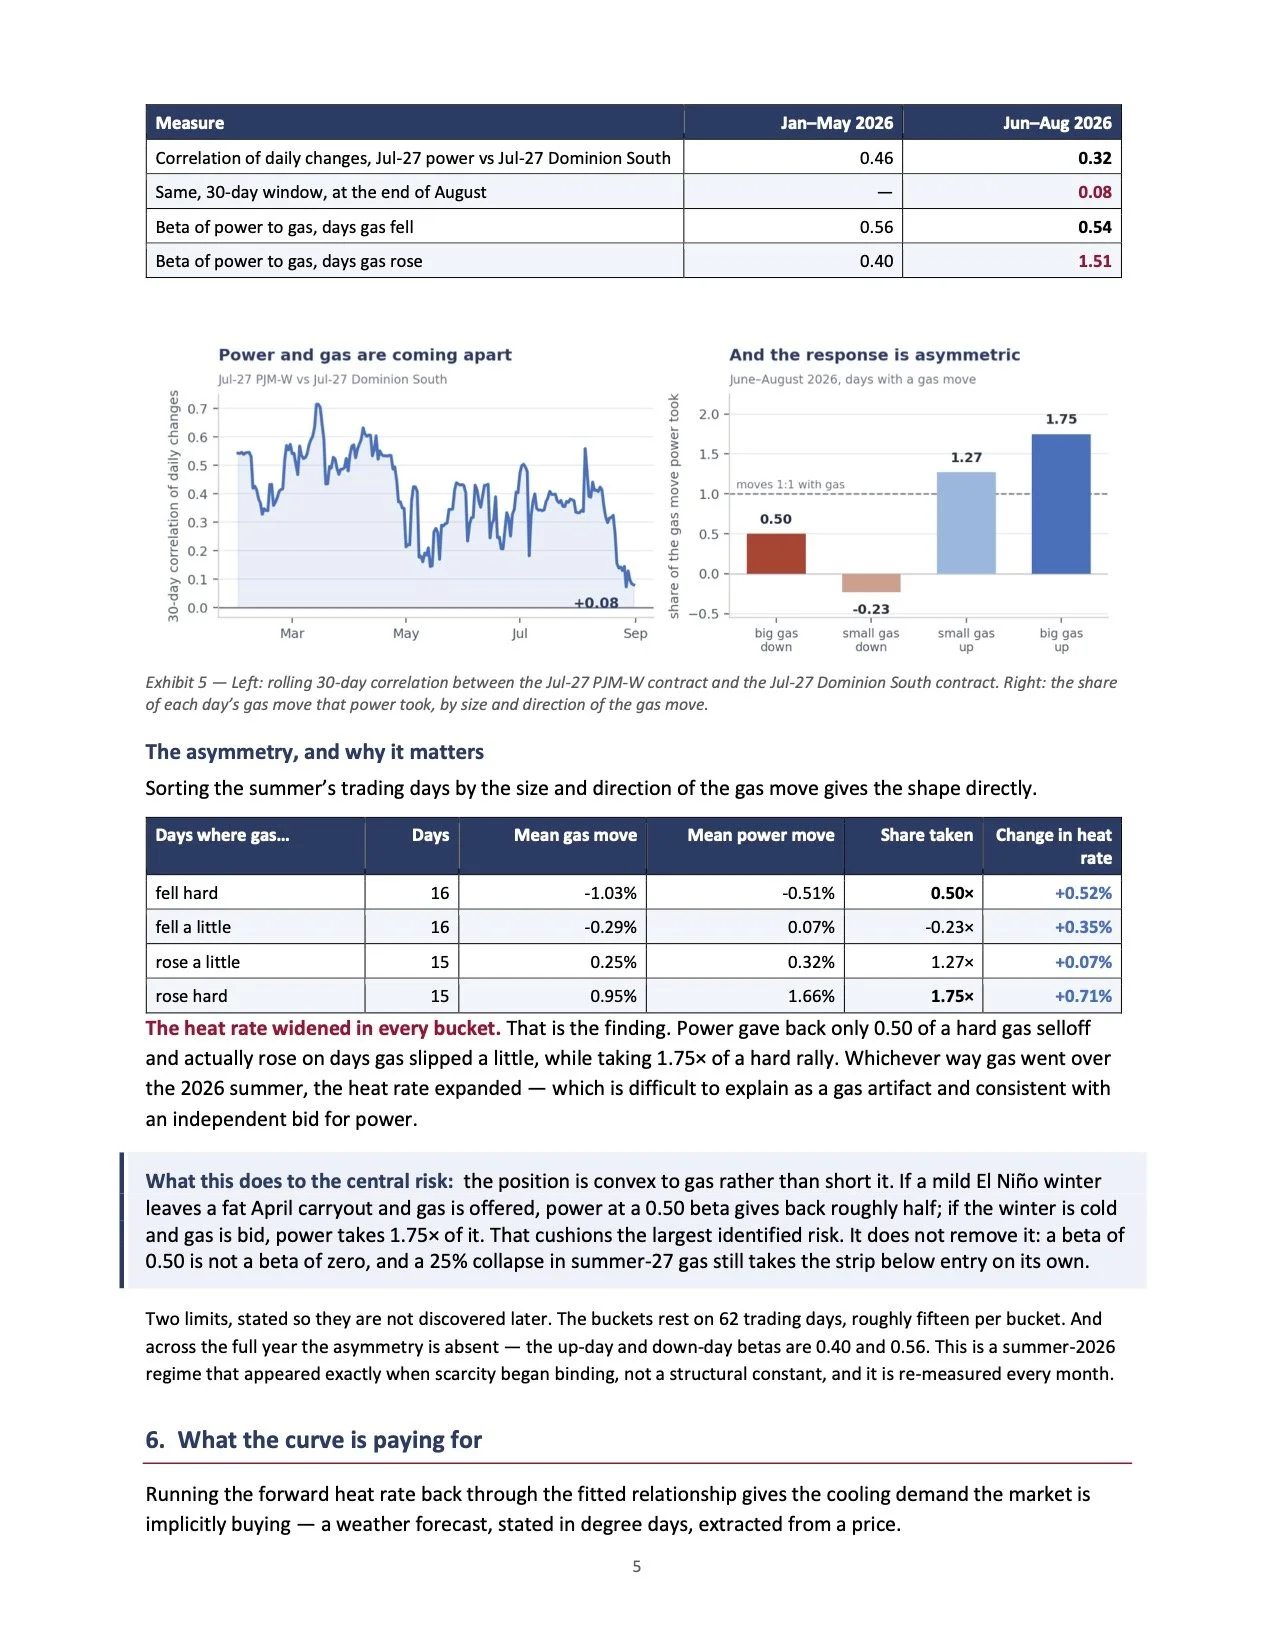
Correlation of daily changes, Jul-27 power vs Jul-27 Dominion South 0.46 0.32 Beta of power to gas, days gas fell 0.56 0.54
Same, 30-day window, at the end of August
—
0.08
Beta of power to gas, days gas rose
0.40
1.51
Exhibit 5 — Left: rolling 30-day correlation between the Jul-27 PJM-W contract and the Jul-27 Dominion South contract. Right: the share of each day’s gas move that power took, by size and direction of the gas move.
The asymmetry, and why it matters
Sorting the summer’s trading days by the size and direction of the gas move gives the shape directly.
fell hard 16 -1.03% -0.51% 0.50× +0.52% rose a little 15 0.25% 0.32% 1.27× +0.07%
The heat rate widened in every bucket. That is the finding. Power gave back only 0.50 of a hard gas selloff and actually rose on days gas slipped a little, while taking 1.75× of a hard rally. Whichever way gas went over the 2026 summer, the heat rate expanded — which is difficult to explain as a gas artifact and consistent with an independent bid for power.
Two limits, stated so they are not discovered later. The buckets rest on 62 trading days, roughly fifteen per bucket. And across the full year the asymmetry is absent — the up-day and down-day betas are 0.40 and 0.56. This is a summer-2026 regime that appeared exactly when scarcity began binding, not a structural constant, and it is re-measured every month.
6. What the curve is paying for
Running the forward heat rate back through the fitted relationship gives the cooling demand the market is implicitly buying — a weather forecast, stated in degree days, extracted from a price.
Days where gas...
Days
Mean gas move
Mean power move
Share taken
Change in heat rate
fell a little
16
-0.29%
0.07%
-0.23×
+0.35%
rose hard
15
0.95%
1.66%
1.75×
+0.71%
What this does to the central risk: the position is convex to gas rather than short it. If a mild El Niño winter leaves a fat April carryout and gas is offered, power at a 0.50 beta gives back roughly half; if the winter is cold and gas is bid, power takes 1.75× of it. That cushions the largest identified risk. It does not remove it: a beta of 0.50 is not a beta of zero, and a 25% collapse in summer-27 gas still takes the strip below entry on its own.
5
Contract
Forward heat rate
Implied CDD
Normal
Post-super El Niño
Gap to normal
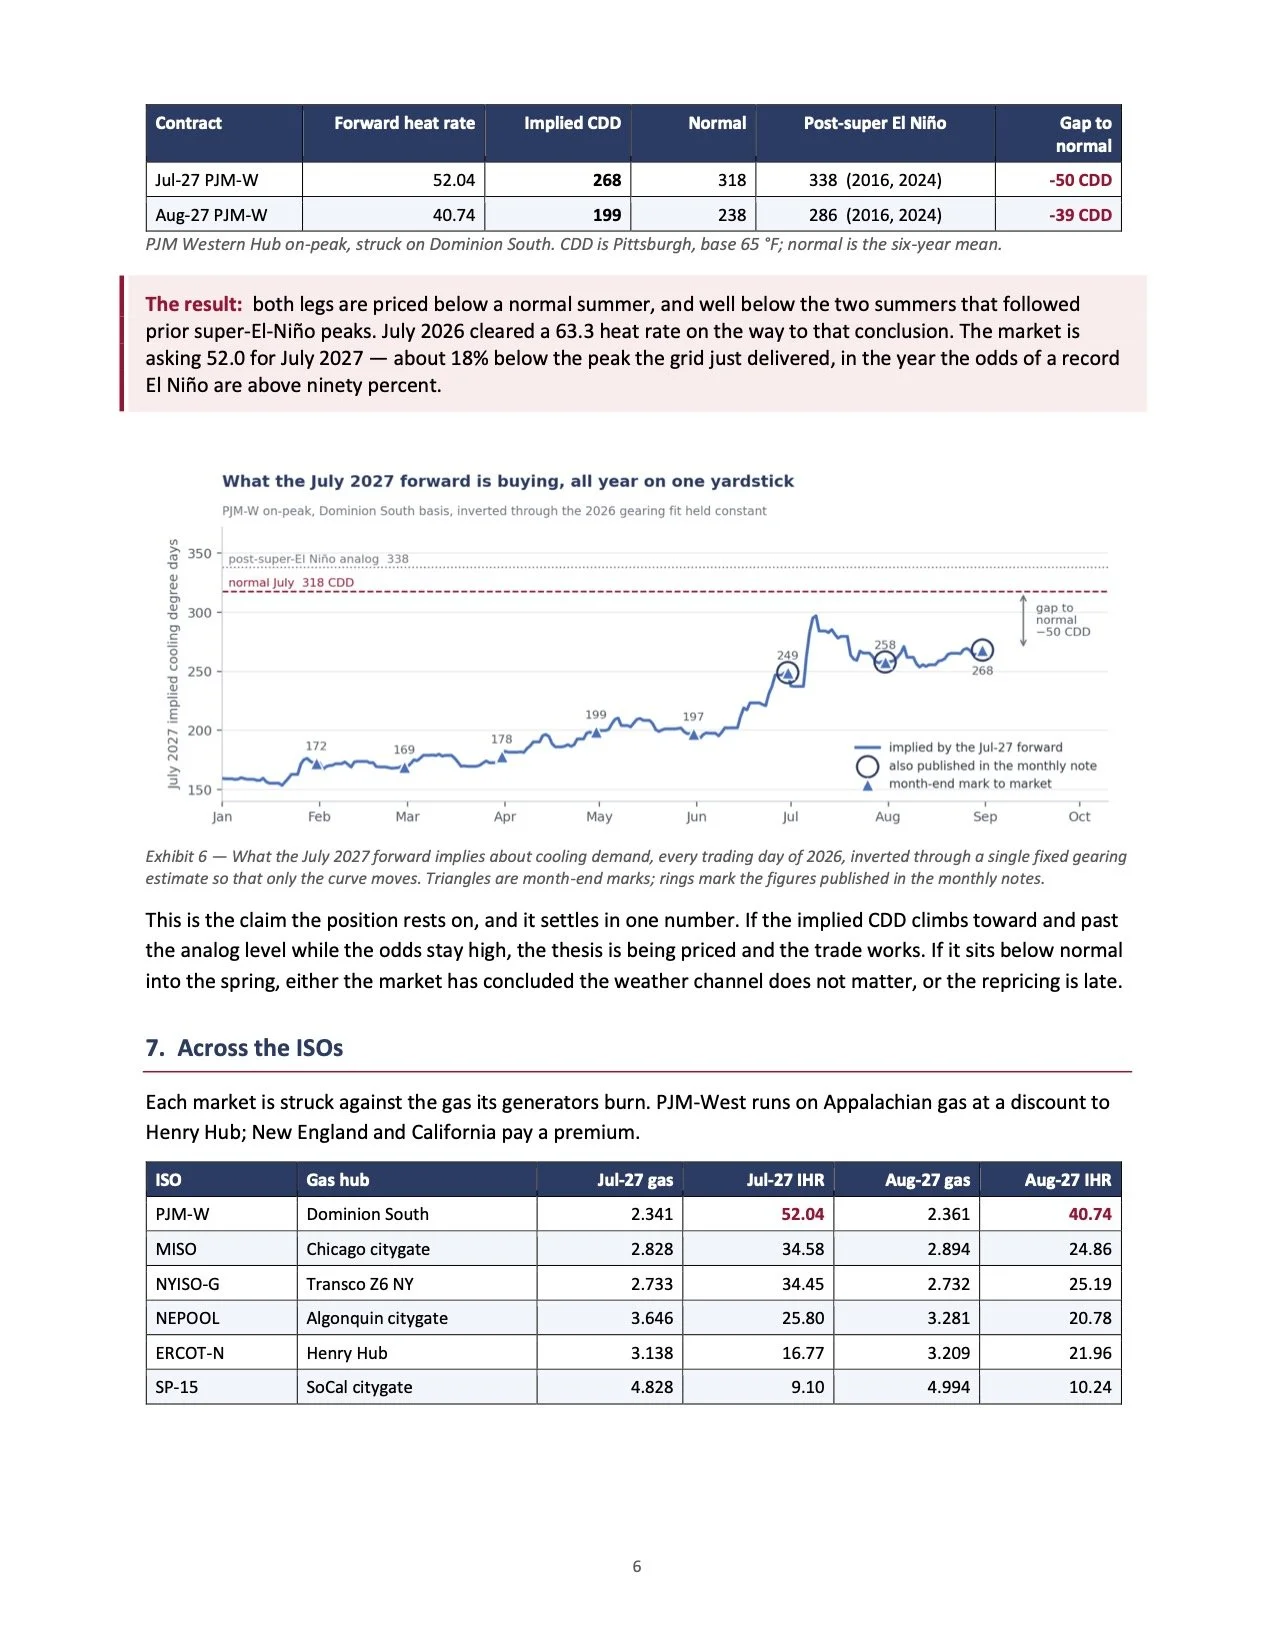
Jul-27 PJM-W 52.04 268 318 338 (2016, 2024) -50 CDD PJM Western Hub on-peak, struck on Dominion South. CDD is Pittsburgh, base 65 °F; normal is the six-year mean.
Aug-27 PJM-W
40.74
199
238
286 (2016, 2024)
-39 CDD
The result: both legs are priced below a normal summer, and well below the two summers that followed prior super-El-Niño peaks. July 2026 cleared a 63.3 heat rate on the way to that conclusion. The market is asking 52.0 for July 2027 — about 18% below the peak the grid just delivered, in the year the odds of a record El Niño are above ninety percent.
Exhibit 6 — What the July 2027 forward implies about cooling demand, every trading day of 2026, inverted through a single fixed gearing estimate so that only the curve moves. Triangles are month-end marks; rings mark the figures published in the monthly notes.
This is the claim the position rests on, and it settles in one number. If the implied CDD climbs toward and past the analog level while the odds stay high, the thesis is being priced and the trade works. If it sits below normal into the spring, either the market has concluded the weather channel does not matter, or the repricing is late.
7. Across the ISOs
Each market is struck against the gas its generators burn. PJM-West runs on Appalachian gas at a discount to Henry Hub; New England and California pay a premium.
ISO
Gas hub
Jul-27 gas
Jul-27 IHR
Aug-27 gas
Aug-27 IHR
PJM-W Dominion South NYISO-G Transco Z6 NY ERCOT-N Henry Hub
2.341 52.04 2.733 34.45 3.138 16.77
2.361 40.74 2.732 25.19 3.209 21.96
MISO
Chicago citygate
2.828
34.58
2.894
24.86
NEPOOL
Algonquin citygate
3.646
25.80
3.281
20.78
SP-15
SoCal citygate
4.828
9.10
4.994
10.24
6
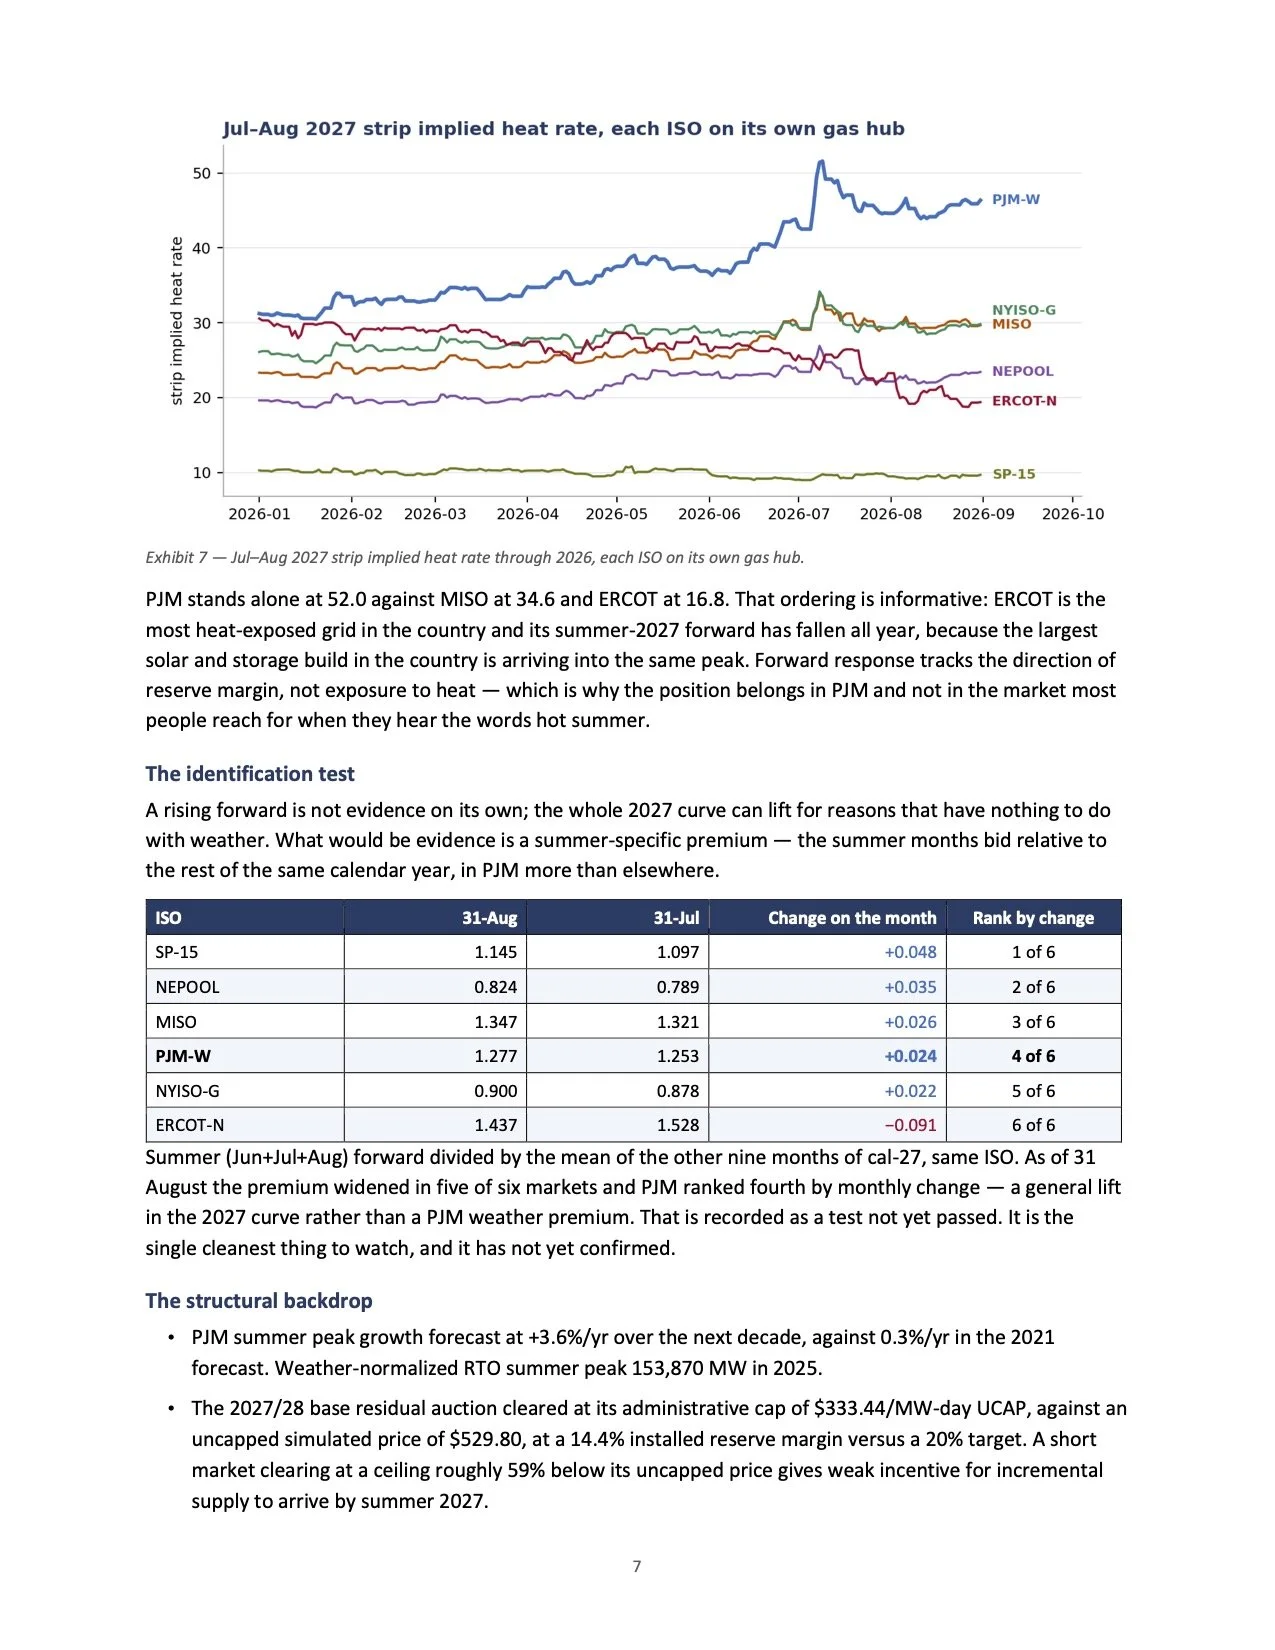
Exhibit 7 — Jul–Aug 2027 strip implied heat rate through 2026, each ISO on its own gas hub.
PJM stands alone at 52.0 against MISO at 34.6 and ERCOT at 16.8. That ordering is informative: ERCOT is the most heat-exposed grid in the country and its summer-2027 forward has fallen all year, because the largest solar and storage build in the country is arriving into the same peak. Forward response tracks the direction of reserve margin, not exposure to heat — which is why the position belongs in PJM and not in the market most people reach for when they hear the words hot summer.
The identification test
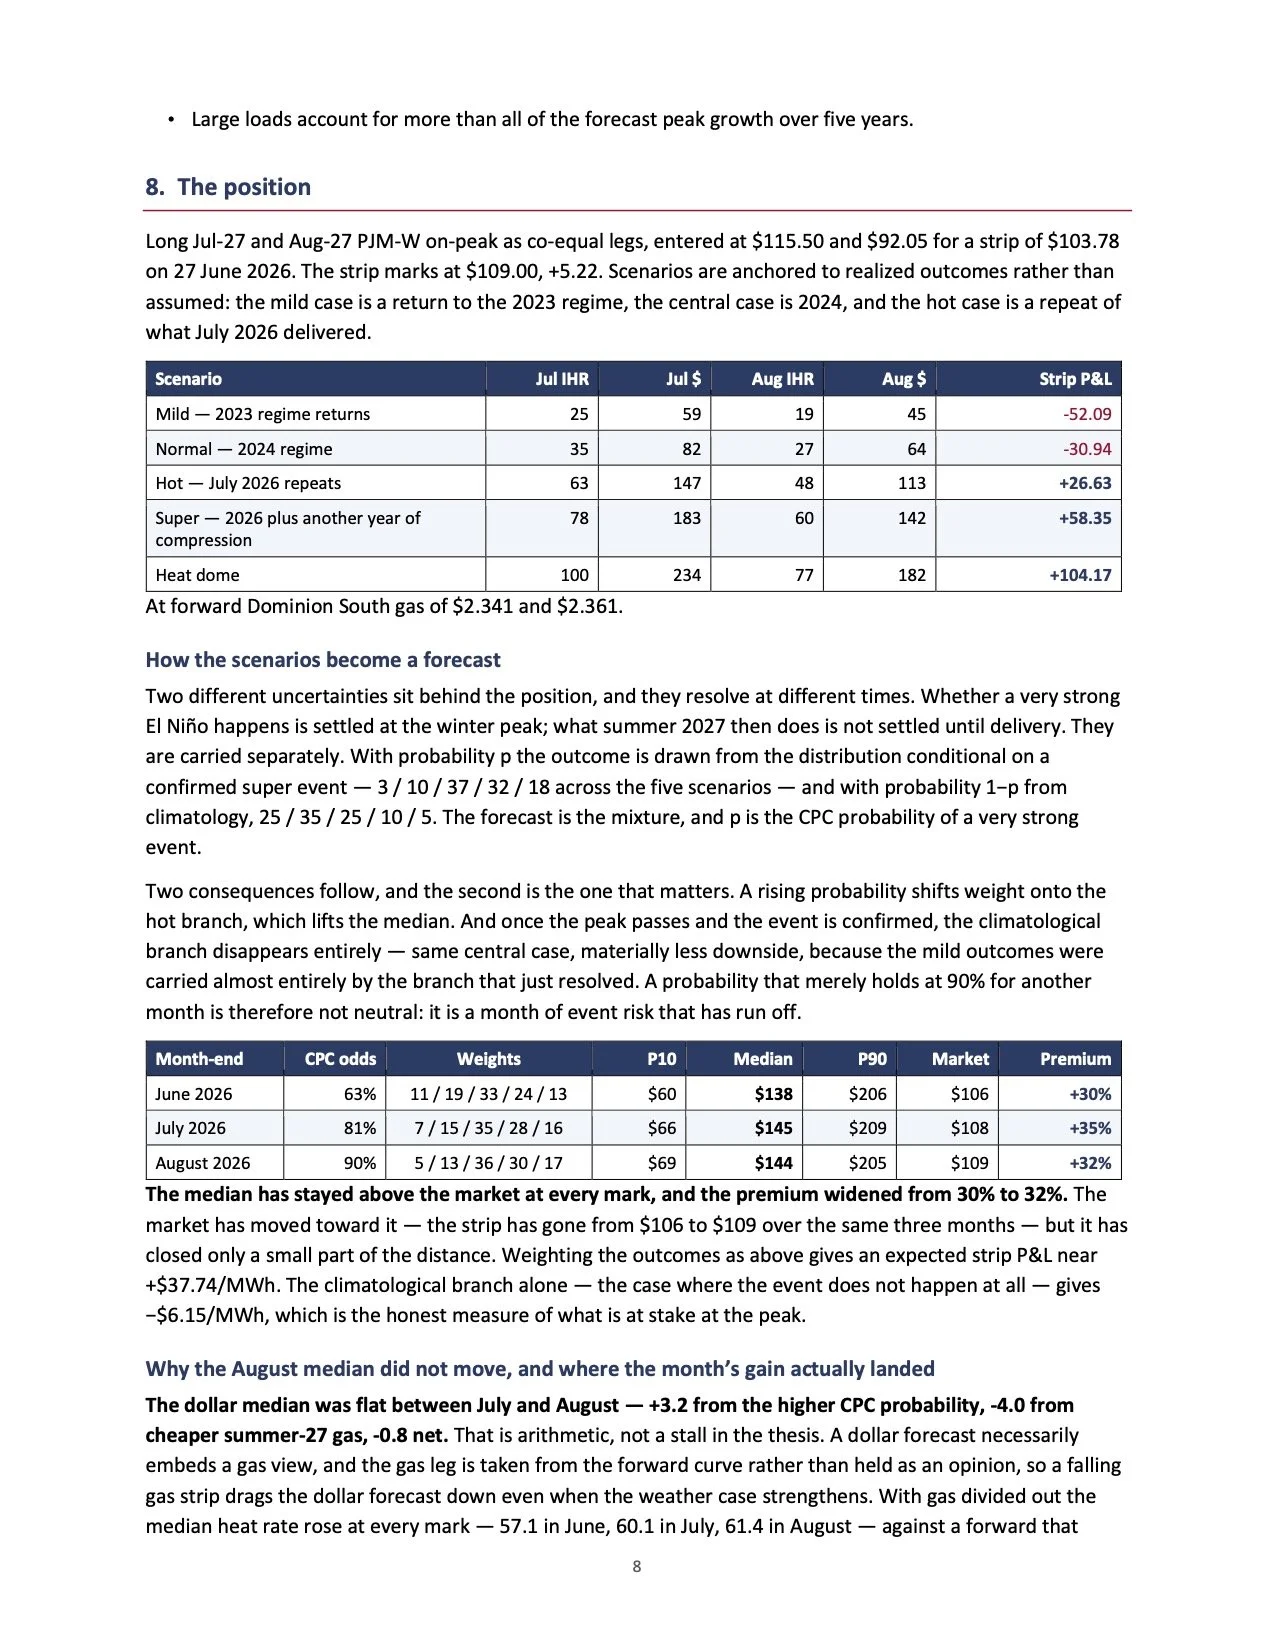
A rising forward is not evidence on its own; the whole 2027 curve can lift for reasons that have nothing to do with weather. What would be evidence is a summer-specific premium — the summer months bid relative to the rest of the same calendar year, in PJM more than elsewhere.
ISO
31-Aug
31-Jul
Change on the month
Rank by change
SP-15 1.145 1.097 MISO 1.347 1.321 NYISO-G 0.900 0.878
+0.048 1 of 6 +0.026 3 of 6 +0.022 5 of 6
NEPOOL
0.824
0.789
+0.035
2 of 6
PJM-W
1.277
1.253
+0.024
4 of 6
ERCOT-N
1.437
1.528
−0.091
6 of 6
Summer (Jun+Jul+Aug) forward divided by the mean of the other nine months of cal-27, same ISO. As of 31 August the premium widened in five of six markets and PJM ranked fourth by monthly change — a general lift in the 2027 curve rather than a PJM weather premium. That is recorded as a test not yet passed. It is the single cleanest thing to watch, and it has not yet confirmed.
The structural backdrop
PJM summer peak growth forecast at +3.6%/yr over the next decade, against 0.3%/yr in the 2021 forecast. Weather-normalized RTO summer peak 153,870 MW in 2025.
The 2027/28 base residual auction cleared at its administrative cap of $333.44/MW-day UCAP, against an uncapped simulated price of $529.80, at a 14.4% installed reserve margin versus a 20% target. A short market clearing at a ceiling roughly 59% below its uncapped price gives weak incentive for incremental supply to arrive by summer 2027.
7
• Large loads account for more than all of the forecast peak growth over five years. 8. The position
Long Jul-27 and Aug-27 PJM-W on-peak as co-equal legs, entered at $115.50 and $92.05 for a strip of $103.78 on 27 June 2026. The strip marks at $109.00, +5.22. Scenarios are anchored to realized outcomes rather than assumed: the mild case is a return to the 2023 regime, the central case is 2024, and the hot case is a repeat of what July 2026 delivered.
Scenario
Jul IHR
Jul $
Aug IHR
Aug $
Strip P&L
Mild — 2023 regime returns Hot — July 2026 repeats
Heat dome
At forward Dominion South gas of $2.341 and $2.361.
How the scenarios become a forecast
25 59 63 147
19 45 48 113
77 182
-52.09
+26.63
+104.17
Normal — 2024 regime
35
82
27
64
-30.94
Super — 2026 plus another year of compression
78
183
60
142
+58.35
100 234
Two different uncertainties sit behind the position, and they resolve at different times. Whether a very strong El Niño happens is settled at the winter peak; what summer 2027 then does is not settled until delivery. They are carried separately. With probability p the outcome is drawn from the distribution conditional on a confirmed super event — 3 / 10 / 37 / 32 / 18 across the five scenarios — and with probability 1−p from climatology, 25 / 35 / 25 / 10 / 5. The forecast is the mixture, and p is the CPC probability of a very strong event.
Two consequences follow, and the second is the one that matters. A rising probability shifts weight onto the hot branch, which lifts the median. And once the peak passes and the event is confirmed, the climatological branch disappears entirely — same central case, materially less downside, because the mild outcomes were carried almost entirely by the branch that just resolved. A probability that merely holds at 90% for another month is therefore not neutral: it is a month of event risk that has run off.
June 2026 63% 11 / 19 / 33 / 24 / 13 $60 $138 $206 $106 +30%
August 2026 90% 5 / 13 / 36 / 30 / 17 $69 $144 $205 $109 +32% The median has stayed above the market at every mark, and the premium widened from 30% to 32%. The
market has moved toward it — the strip has gone from $106 to $109 over the same three months — but it has closed only a small part of the distance. Weighting the outcomes as above gives an expected strip P&L near +$37.74/MWh. The climatological branch alone — the case where the event does not happen at all — gives −$6.15/MWh, which is the honest measure of what is at stake at the peak.
Why the August median did not move, and where the month’s gain actually landed
The dollar median was flat between July and August — +3.2 from the higher CPC probability, -4.0 from cheaper summer-27 gas, -0.8 net. That is arithmetic, not a stall in the thesis. A dollar forecast necessarily embeds a gas view, and the gas leg is taken from the forward curve rather than held as an opinion, so a falling gas strip drags the dollar forecast down even when the weather case strengthens. With gas divided out the median heat rate rose at every mark — 57.1 in June, 60.1 in July, 61.4 in August — against a forward that
Month-end
CPC odds
Weights
P10
Median
P90
Market
Premium
July 2026
81%
7 / 15 / 35 / 28 / 16
$66
$145
$209
$108
+35%
8
moved 43.8 to 46.4. The bottom panel of Exhibit 1 is that series. The month’s real gain landed in the tail rather than the middle: the dollar tenth percentile rose from $66 to $69.
The tenth percentile still sits at $69, below the $103.78 entry. That is the branch where the event does not materialise, and it carries real weight until the peak resolves. Section 9 is how you act on it before settlement rather than after.
Note that the compounding runs both ways. Price is heat rate times gas, so the bull cases multiply — and so do the bear cases. Only the scarcity tail is one-directional.
Where a held 90% actually pays: not in the median, which is close to saturated — from today's 90% to a hypothetical certainty the median heat rate moves 61.4 to 62.7. It pays in the left tail and the width. Confirming the event lifts the tenth percentile from 29.5 to 33.1 and takes the P25–P75 range from 29.8 to 27.3. In dollars the tenth percentile goes from $69 to $78 — from well below entry to comfortably above it. That is the whole case for holding through the winter: the median was always going to be high, and what improves from here is the chance of being wrong.
9. What would break it
1 A mild El Niño winter crushes December–February gas burn and leaves a fat April 2027 carryout. Cheap gas widens the heat rate and shrinks the dollars — the scarcity call can be right while the position loses.
2
3 Data-center load proves overstated. IEEFA and Grid Strategies argue PJM is counting interconnection requests that will not arrive.
4
5 The El Niño fizzles — CPC odds below 50%, or Niño 3.4 peaking under +1.5 °C. 6
Live, cushioned
Watching
Not tripped
Risk
Status
PJM revises the summer-2027 peak down again. It has already cut roughly 4 GW on stricter large-load vetting. The forecast is annual, so no second revision is possible before January 2027.
Watching
The forward heat rate contracts for two consecutive months on flat gas.
Not tripped
Solar and storage begin eroding the fat tail rather than the thin one, as they have in ERCOT.
Not tripped in PJM
The first risk still deserves the most attention, but it is now partly measured rather than only feared. The heat-rate call and the dollar call are different bets, and a mild winter followed by a hot summer can produce a wide heat rate on cheap gas that still settles the strip below $103.78. What Section 5 adds is the size of that exposure: over the 2026 summer power took only 0.50 of hard gas selloffs, so the damage is roughly half of what a one-for-one pass-through would imply. Every monthly update grades gas, heat rate and $/MWh as three separate calls, and re-estimates that beta.
10. The monthly test
Eight measures, recomputed from the same sources at each month-end, and graded in an append-only log so that a call cannot be quietly revised after the fact.
Link
Measure
ENSO Price Price
CPC probability of a very strong event, and the Niño 3.4 anomaly
Realized monthly on-peak heat rate, all six ISOs on their own gas
Power-to-gas correlation and the up/down beta asymmetry
Load
On-peak hours above 150 GW, summer to date
Price
Fitted CDD gearing and base level, refit as data accumulates
9
Link
Measure
Curve
CDD implied by the Jul-27 and Aug-27 forwards — the headline test, tracked in Exhibit 6
Curve Summer-27 premium by ISO — the identification test
The implied CDD is the one to watch. It is 268 today against a normal of 318, having risen from 172 in January on a constant yardstick. The gearing estimate that produces it now rests on a full June-to-August summer of 66 days.
11. Data and method
On-peak is 5×16 — weekdays, hours-ending 8 through 23, excluding 4 July. Implied heat rate is the on-peak average real-time LMP divided by the gas that ISO’s generators burn: Dominion South for PJM-West, Chicago citygate for MISO, Transco Z6 NY for NYISO, Algonquin citygate for New England, SoCal citygate for SP-15, and Henry Hub for ERCOT. Forwards use ICE monthly settles at each hub; realized months use monthly average spot at the same hub. PJM figures pair Western Hub prices with PJM-RTO load, and RTO record-load figures from PJM press releases are never mixed with Western Hub prices in one statement.
Gearing is fitted by ordinary least squares of daily on-peak implied heat rate on daily Pittsburgh cooling degree days, June through August, one fit per summer. Regional gas spot supports fits from 2020, so the series is anchored to 2022. Cooling degree days carry a vendor timestamp one calendar day earlier than the day they measure; every fit was restated on 7 September 2026 to correct that alignment, and the superseded fits are retained for audit. The underlying relationship is convex rather than linear — the linear slope is a summary statistic, not a structural constant, and it is refit monthly.
The forecast in Exhibit 1 is the Section 8 scenario set — five heat-rate outcomes anchored to realized summers — priced at each month-end’s forward Dominion South gas and weighted as a two-branch mixture: with probability p, the distribution conditional on a confirmed very strong El Niño; with probability 1−p, climatology. p is the CPC probability at that date. Beyond the last mark the cone is projected on the assumption that the event confirms at the winter peak, with p rising to one between 31 December 2026 and 28 February 2027 — the shaded column in Exhibit 1. The conditional weights are a judgement, stated in Section 8 so they can be argued with. Percentiles are interpolated from the weighted discrete distribution. The scenarios themselves are held fixed; only the weights and the gas move. No forecast was published before June 2026, so the series begins there.
Section 5 uses daily log changes in the Jul-27 contract at each hub over calendar 2026 to 31 August; days of zero gas change are excluded from the bucket sort, and buckets split gas-down and gas-up days at their respective medians.
Cooling degree days are Pittsburgh, base 65 °F, a single-station proxy for PJM-area heat, with paired cities for the other ISOs — trading accuracy for auditability. Not modeled: transmission congestion, unit-level outages, intra-month roll and shaping, and Western Hub basis to other PJM zones.
ENSO figures come from the NOAA CPC ENSO Diagnostic Discussions of 12 March, 14 May, 11 June, 9 July and 13 August 2026. CPC publishes on the second Thursday while marks are taken at month-end, so the ENSO leg may be up to three weeks older than the market leg; the issue date is stated each time. The next discussion is scheduled for 10 September 2026.
Analytical scenario work, not investment advice. Structuring and sizing rest with the desk.
Forecast
Our weighted scenario median against the market forward — the record, tracked in Exhibit 1
10
