
1-mo Power Trade Lab: September 2026
All 20 backtested trades on the ICE 1-mo U.S. power index (ICEPPWRT), updated with seGlement data through September 30, 2026
The 1-mo power index rose 15.5% in September, its biggest monthly gain since January, and finished the third quarter up 21.0% for the year. The 12-mo index gained 9.9% in the month, while natural gas (BCOMNGTR) slipped 0.9% and is down 21.3% for the year. Power and gas have now moved in opposite direcYons by more than 40 points in 2026.
Most of the trades lean short, so a steady rally in the index cost them money. Eleven of the 20 strategies lost in September, five gained and four were flat. Even so, the rankings did not change: every trade holds the same place it had on September 21, and the top three are unchanged.
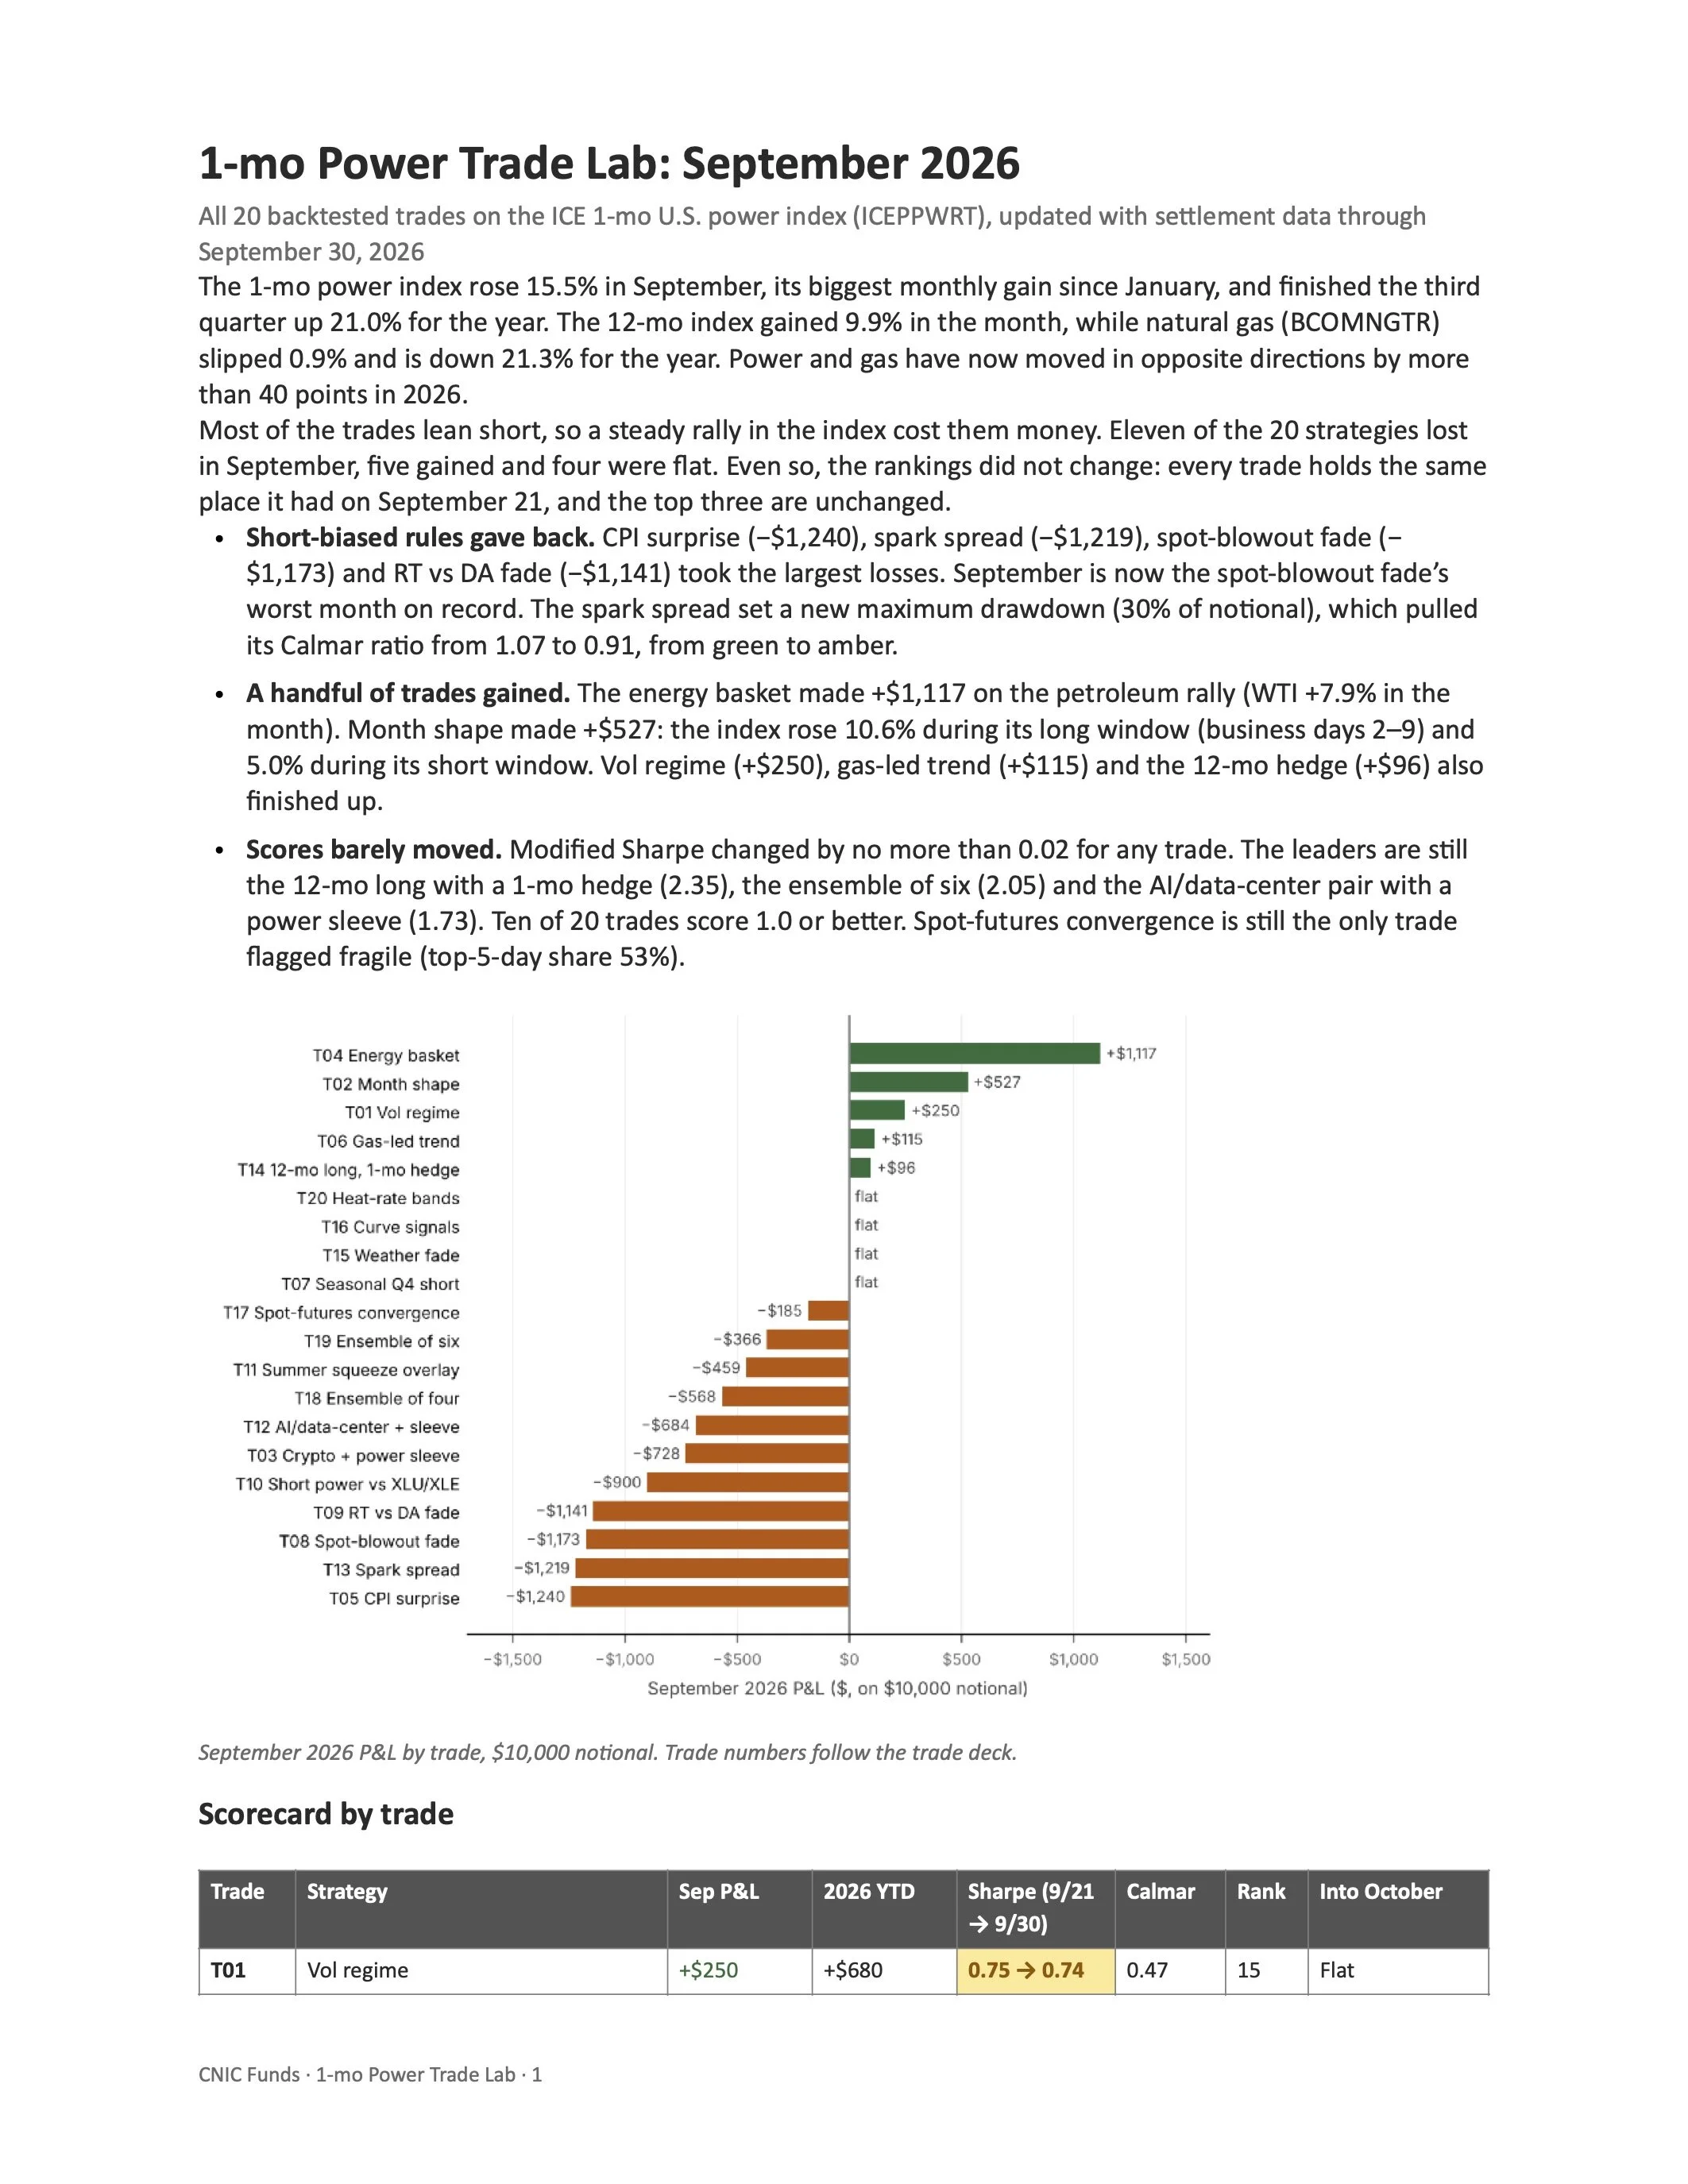
Short-biased rules gave back. CPI surprise (−$1,240), spark spread (−$1,219), spot-blowout fade (− $1,173) and RT vs DA fade (−$1,141) took the largest losses. September is now the spot-blowout fade’s worst month on record. The spark spread set a new maximum drawdown (30% of noYonal), which pulled its Calmar raYo from 1.07 to 0.91, from green to amber.
A handful of trades gained. The energy basket made +$1,117 on the petroleum rally (WTI +7.9% in the month). Month shape made +$527: the index rose 10.6% during its long window (business days 2–9) and 5.0% during its short window. Vol regime (+$250), gas-led trend (+$115) and the 12-mo hedge (+$96) also finished up.
Scores barely moved. Modified Sharpe changed by no more than 0.02 for any trade. The leaders are sYll the 12-mo long with a 1-mo hedge (2.35), the ensemble of six (2.05) and the AI/data-center pair with a power sleeve (1.73). Ten of 20 trades score 1.0 or beGer. Spot-futures convergence is sYll the only trade flagged fragile (top-5-day share 53%).
September 2026 P&L by trade, $10,000 no7onal. Trade numbers follow the trade deck.
Scorecard by trade
Trade
Strategy
Sep P&L
2026 YTD
Sharpe (9/21 → 9/30)
Calmar
Rank
Into October
T01
Vol regime
+$250
+$680
0.75 → 0.74
0.47
15
Flat
CNIC Funds · 1-mo Power Trade Lab · 1
Trade
Strategy
Sep P&L
2026 YTD
Sharpe (9/21 → 9/30)
Calmar
Rank
Into October
T02
Month shape
+$527
−$2,919
1.21 → 1.20
0.68
8
Short (bd 11– end)
T03
Crypto + power sleeve
−$728
+$3,860
1.71 → 1.70
1.74
4
Short sleeve
T04
Energy basket
+$1,117
+$9,245
0.60 → 0.62
0.19
20
Held (staYc)
T05
CPI surprise
−$1,240
−$709
1.08 → 1.08
0.84
9
Flat
T06
Gas-led trend
+$115
−$2,054
0.87 → 0.88
0.71
14
Long
T07
Seasonal Q4 short
$0
$0
0.69 → 0.69
0.27
18
Short from Sep 30 close
T08
Spot-blowout fade
−$1,173
+$356
1.31 → 1.29
1.15
6
Short
T09
RT vs DA fade
−$1,141
−$850
0.97 → 0.95
0.89
12
Short
T10
Short power vs XLU/XLE
−$900
+$672
0.72 → 0.70
0.34
17
Held (staYc)
T11
Summer squeeze overlay
−$459
+$4,319
0.74 → 0.73
0.30
16
Base only
T12
AI/data-center + sleeve
−$684
+$6,975
1.75 → 1.73
1.74
3
Short sleeve
T13
Spark spread
−$1,219
+$218
1.29 → 1.27
0.91
7
Short spread
T14
12-mo long, 1-mo hedge
+$96
+$2,313
2.35 → 2.35
2.39
1
Hedged 0.75×
T15
Weather fade
$0
+$4,830
0.99 → 0.99
0.72
11
Flat
T16
Curve signals
$0
+$1,912
0.95 → 0.95
0.65
13
Flat
T17
Spot-futures convergence *
−$185
+$1,267
0.68 → 0.66
0.37
19
Flat
T18
Ensemble of four
−$568
+$831
1.65 → 1.63
1.45
5
Mixed
T19
Ensemble of six
−$366
+$435
2.05 → 2.05
2.34
2
Mixed
T20
Heat-rate bands
$0
+$2,308
1.02 → 1.02
0.61
10
Flat
Sharpe shading: green ≥ 1.0, amber 0.5–1.0, red < 0.5. Rank by Modified Sharpe (Calmar breaks Yes). * Fragile: top-5 days ≥ 50% of total P&L. Backtest windows run from Feb 2018 (Seasonal Q4 short from Jan 2014) to Sep 30, 2026. PosiYons are as of the Sep 30 close.
Going into October
The Seasonal Q4 short took on its posiYon at the September 30 close, its first of the 2026 season. It has made money in 11 of 12 past Q4s. Month shape is short for the rest of the month and switches to long on October 2. The spot-blowout fade, RT vs DA fade and spark spread all carry shorts from late-September signals. Gas- led trend is long. The 12-mo long carries its 0.75× hedge, and the Oct–Dec trigger keeps it on through year- end. Vol regime, CPI surprise, weather fade, curve signals, convergence and heat-rate bands are flat.
Data notes
Window. SeGlement data run through September 30, 2026. The October 1 row in the data pull carries
prices that had not yet seGled and is excluded.
Curve-based trades now use actual data. The ICE spot and excess-return indexes (ICEPPWRS, ICEPPWRE) and BCOM Energy TR now run to September 30. The curve-signals, spot-futures convergence and heat- rate trades and the energy basket no longer stop at September 1 or carry the last value forward.
InflaWon. September CPI is released in mid-October, so the CPI-surprise trade sYll runs on the August print. It went flat aper that print on September 16.
Weather. NOAA CPC degree days were refreshed on October 1. Cooling degree days run through September 23 and heaYng degree days through September 29. Neither weather trigger fired in late September.
CNIC Funds · 1-mo Power Trade Lab · 2
• Cash gas. The cash-gas history in the data pull now goes back to 2018. The trade rules are unchanged: gas-based variants are sYll scored from March 2020 so results stay comparable.
Results are hypothe7cal backtests on indexes, priced at mid-market with no fees, spreads or margin, using 252-day annualiza7on and no risk- free rate. They are not indica7ve of future results. Source: Bloomberg; NOAA CPC; FRED; CNIC analysis.
CNIC Funds · 1-mo Power Trade Lab · 3
