
EL NIÑO vs POWER PRICES · MONTHLY UPDATE
September 2026
Long Jul-27 / Aug-27 PJM Western Hub on-peak · markets as of 30 September 2026 · ENSO as of 10 September 2026
The case, and where it now stands
The posiHon is built on three claims: that a record El Niño makes summer 2027 hot, that PJM has become far more sensiHve to heat as its reserve margin has thinned, and that the forward curve had priced neither. September was the first month in which the market visibly began to agree.
The spark is widening, and it is power doing the work. Since April the Jul-27 contract has risen +41.4% while the Dominion South gas it burns has fallen 4.8%. The implied heat rate has gone from 40.6 to 60.4, +48.6%. In September alone the heat rate widened +16.1%, of which 16.8 points came from the power price and none from gas, which was slightly higher on the month. This is a power market repricing, not a gas arHfact.
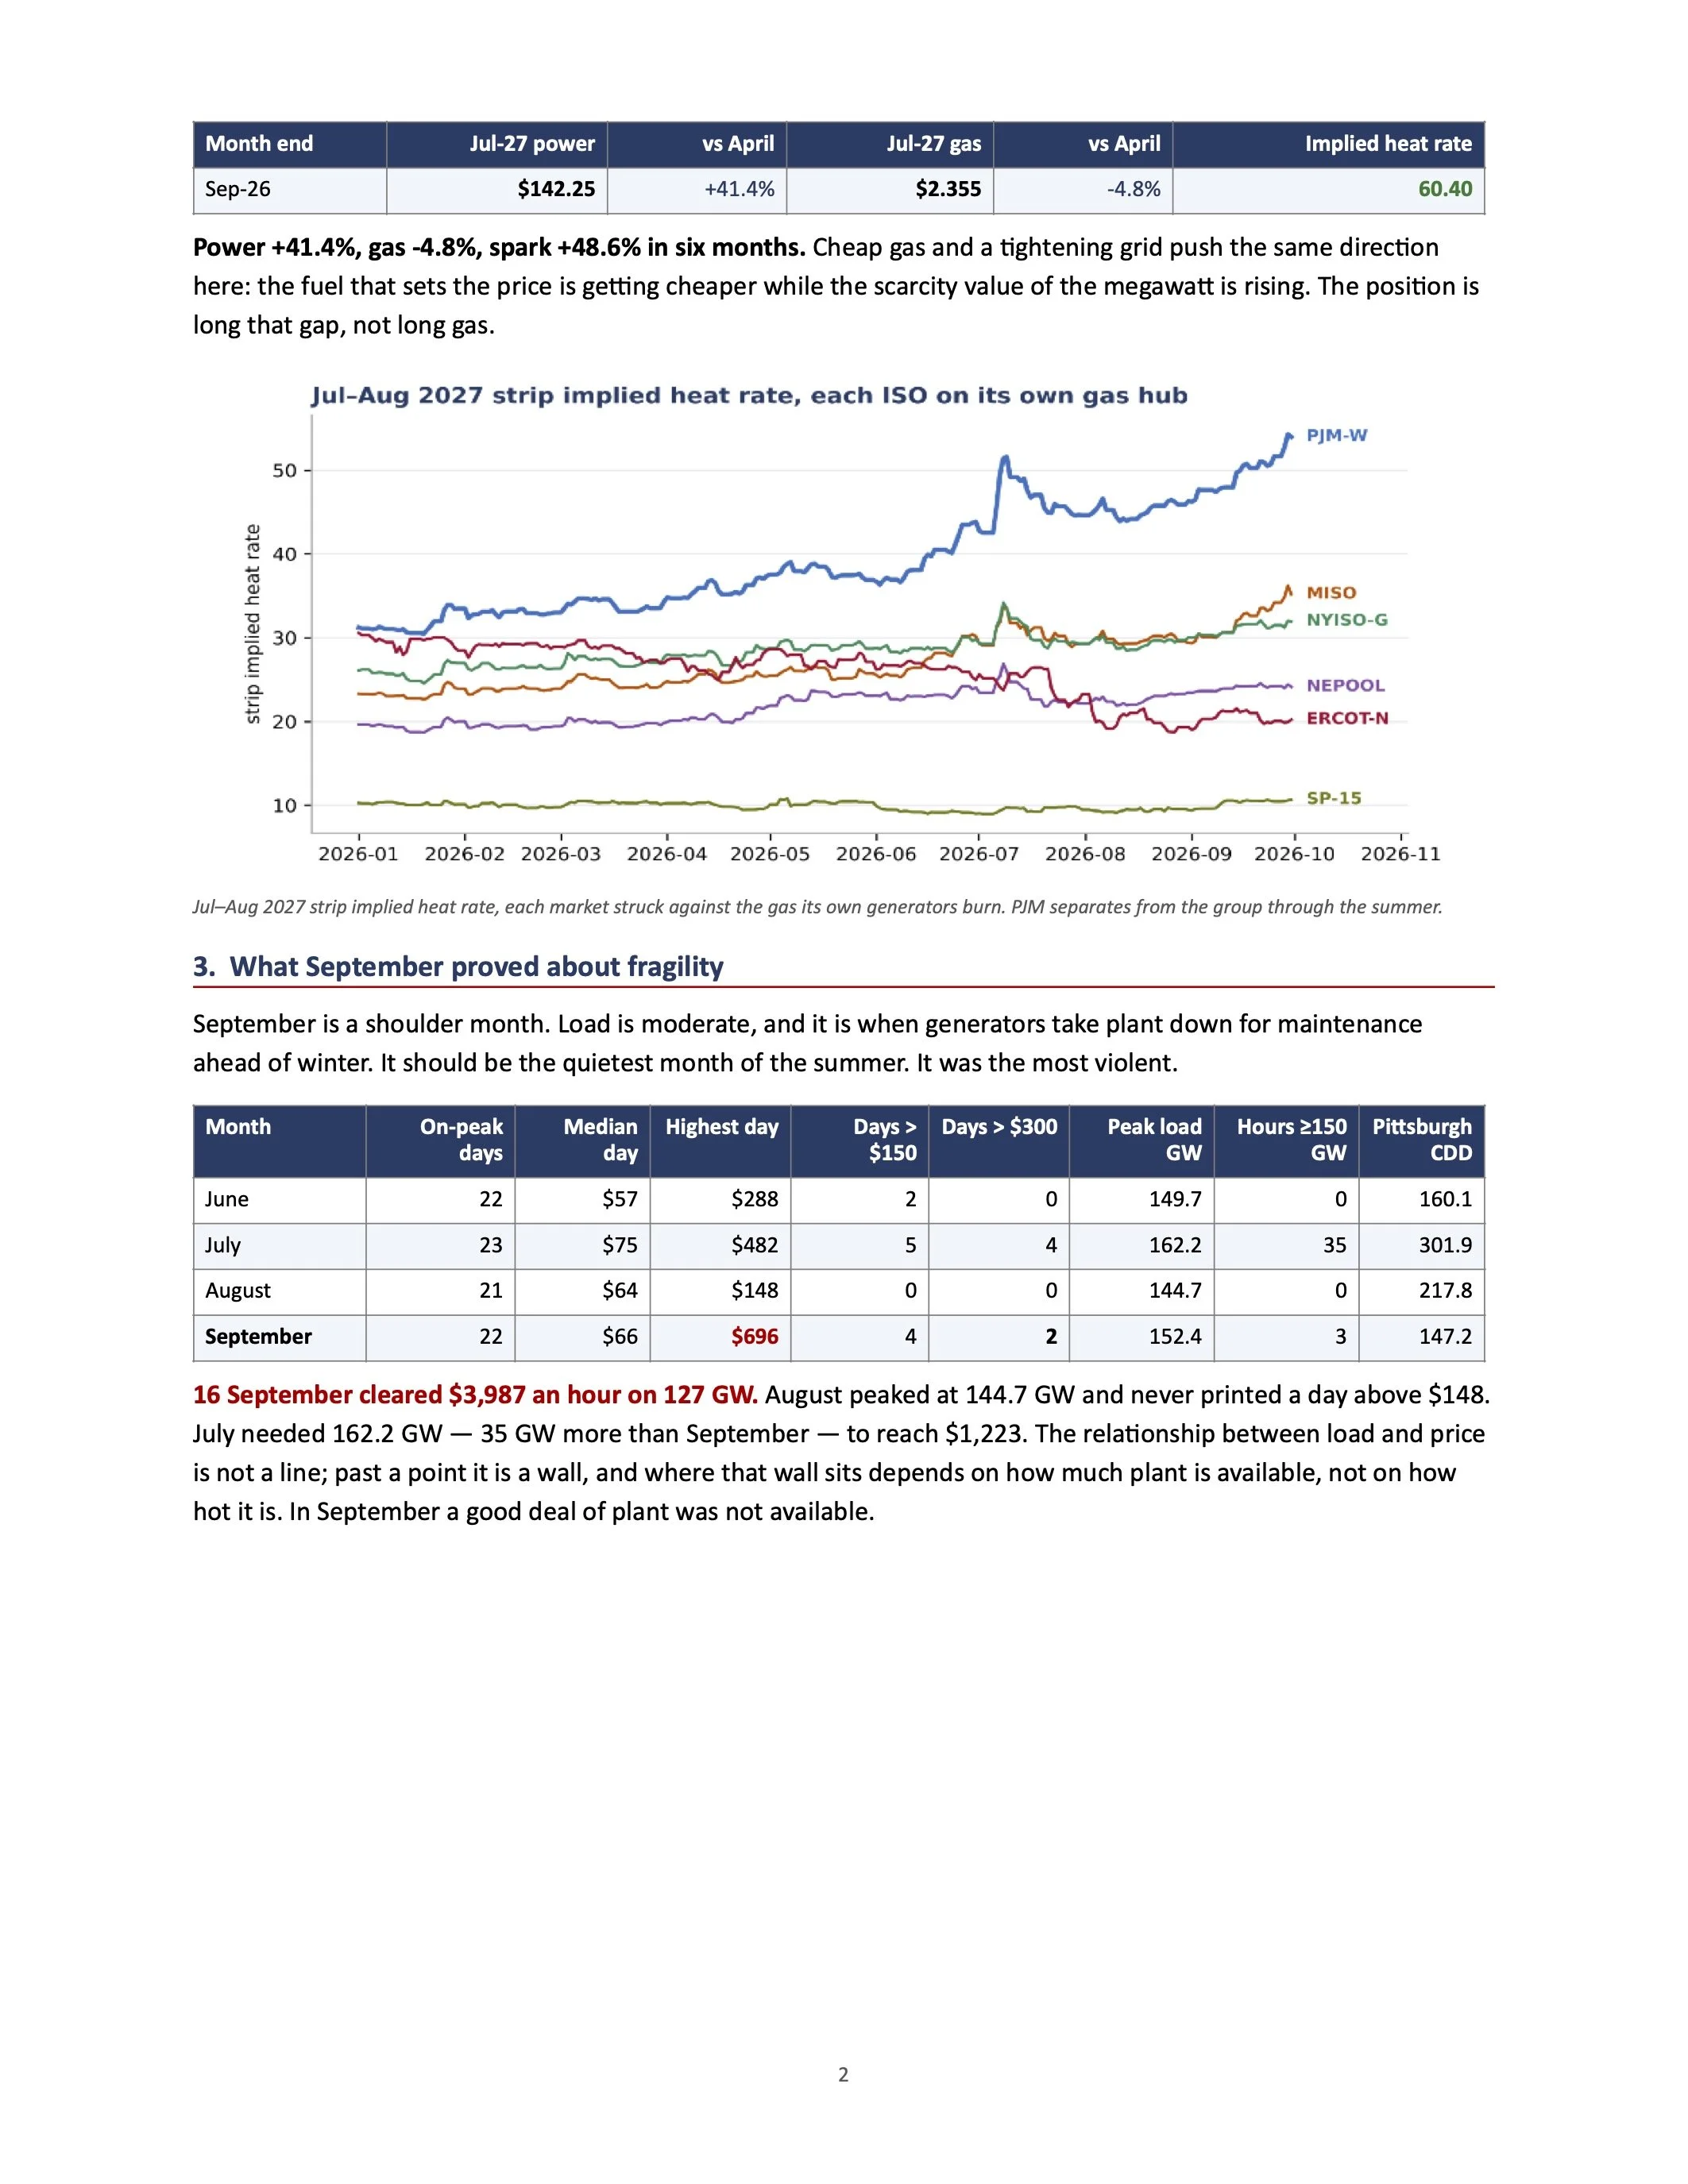
September showed what a Lght system does under ordinary stress. On 16 September PJM Western Hub cleared $3,987/MWh in the peak hour and averaged $696 across the on-peak day — on 127 GW of load. July's worst day needed 162.2 GW to reach $1,223. A shoulder month with plant in maintenance produced the highest print of the year on two-thirds of the summer peak. That is what a 14.4% reserve margin looks like when something goes wrong.
And the curve has started to pay for it. The cooling demand implied by the Jul-27 forward has risen from 268 to 319 degree days, reaching the 314 six-year mean for the first Hme. PJM's summer-2027 premium widened more than every market but one. The strip is $23.59 above entry, of which $18.38 came this month.
And demand keeps rising underneath all of it. Holding weather fixed, PJM carries 5.8 GW more load on a mild summer day than it did in 2023, and 8.3 GW more on a warm one. That is demand growth, not heat. It means the grid begins each summer closer to the point where price stops behaving linearly.
1. PosiLon
Heat rates struck on Dominion South, the gas PJM genera7on actually burns. Gas, heat rate and dollars per megawa@ hour are tracked as three separate calls.
2. Power is rising while its gas falls
The Jul-27 contract against the Jul-27 Dominion South contract, at each month end. If the heat-rate widening were a gas story, the middle column would be doing the work. It is not.
Where that leaves us: the discount the posiHon was struck at has largely been paid — the curve no longer prices a cool summer. What remains is the analog: the two summers that followed previous super-El Niño peaks delivered 326 and 300 degree days, and the forward is 7 and 59 short of those. Note where that sits. July is nearly fully priced; almost all of the remaining weather value is in the August leg.
Leg
Entry 27-Jun-26
30 Sep
P&L $/MWh
Fwd heat rate
Δ on the month
Jul-27 PJM-W
115.50
142.25
26.75
60.40
+16.1%
Aug-27 PJM-W
92.05
112.50
20.45
47.55
+16.7%
Strip
103.78
127.38
23.59
—
+16.9%
Month end
Jul-27 power
vs April
Jul-27 gas
vs April
Implied heat rate
Apr-26
$100.60
+0.0%
$2.475
+0.0%
40.65
May-26
$97.50
-3.1%
$2.414
-2.5%
40.39
Jun-26
$118.45
+17.7%
$2.417
-2.3%
49.01
Jul-26
$121.50
+20.8%
$2.406
-2.8%
50.50
Aug-26
$121.80
+21.1%
$2.341
-5.4%
52.03
1
Month end Jul-27 power vs April Jul-27 gas vs April Implied heat rate
Sep-26 $142.25 +41.4% $2.355 -4.8% 60.40
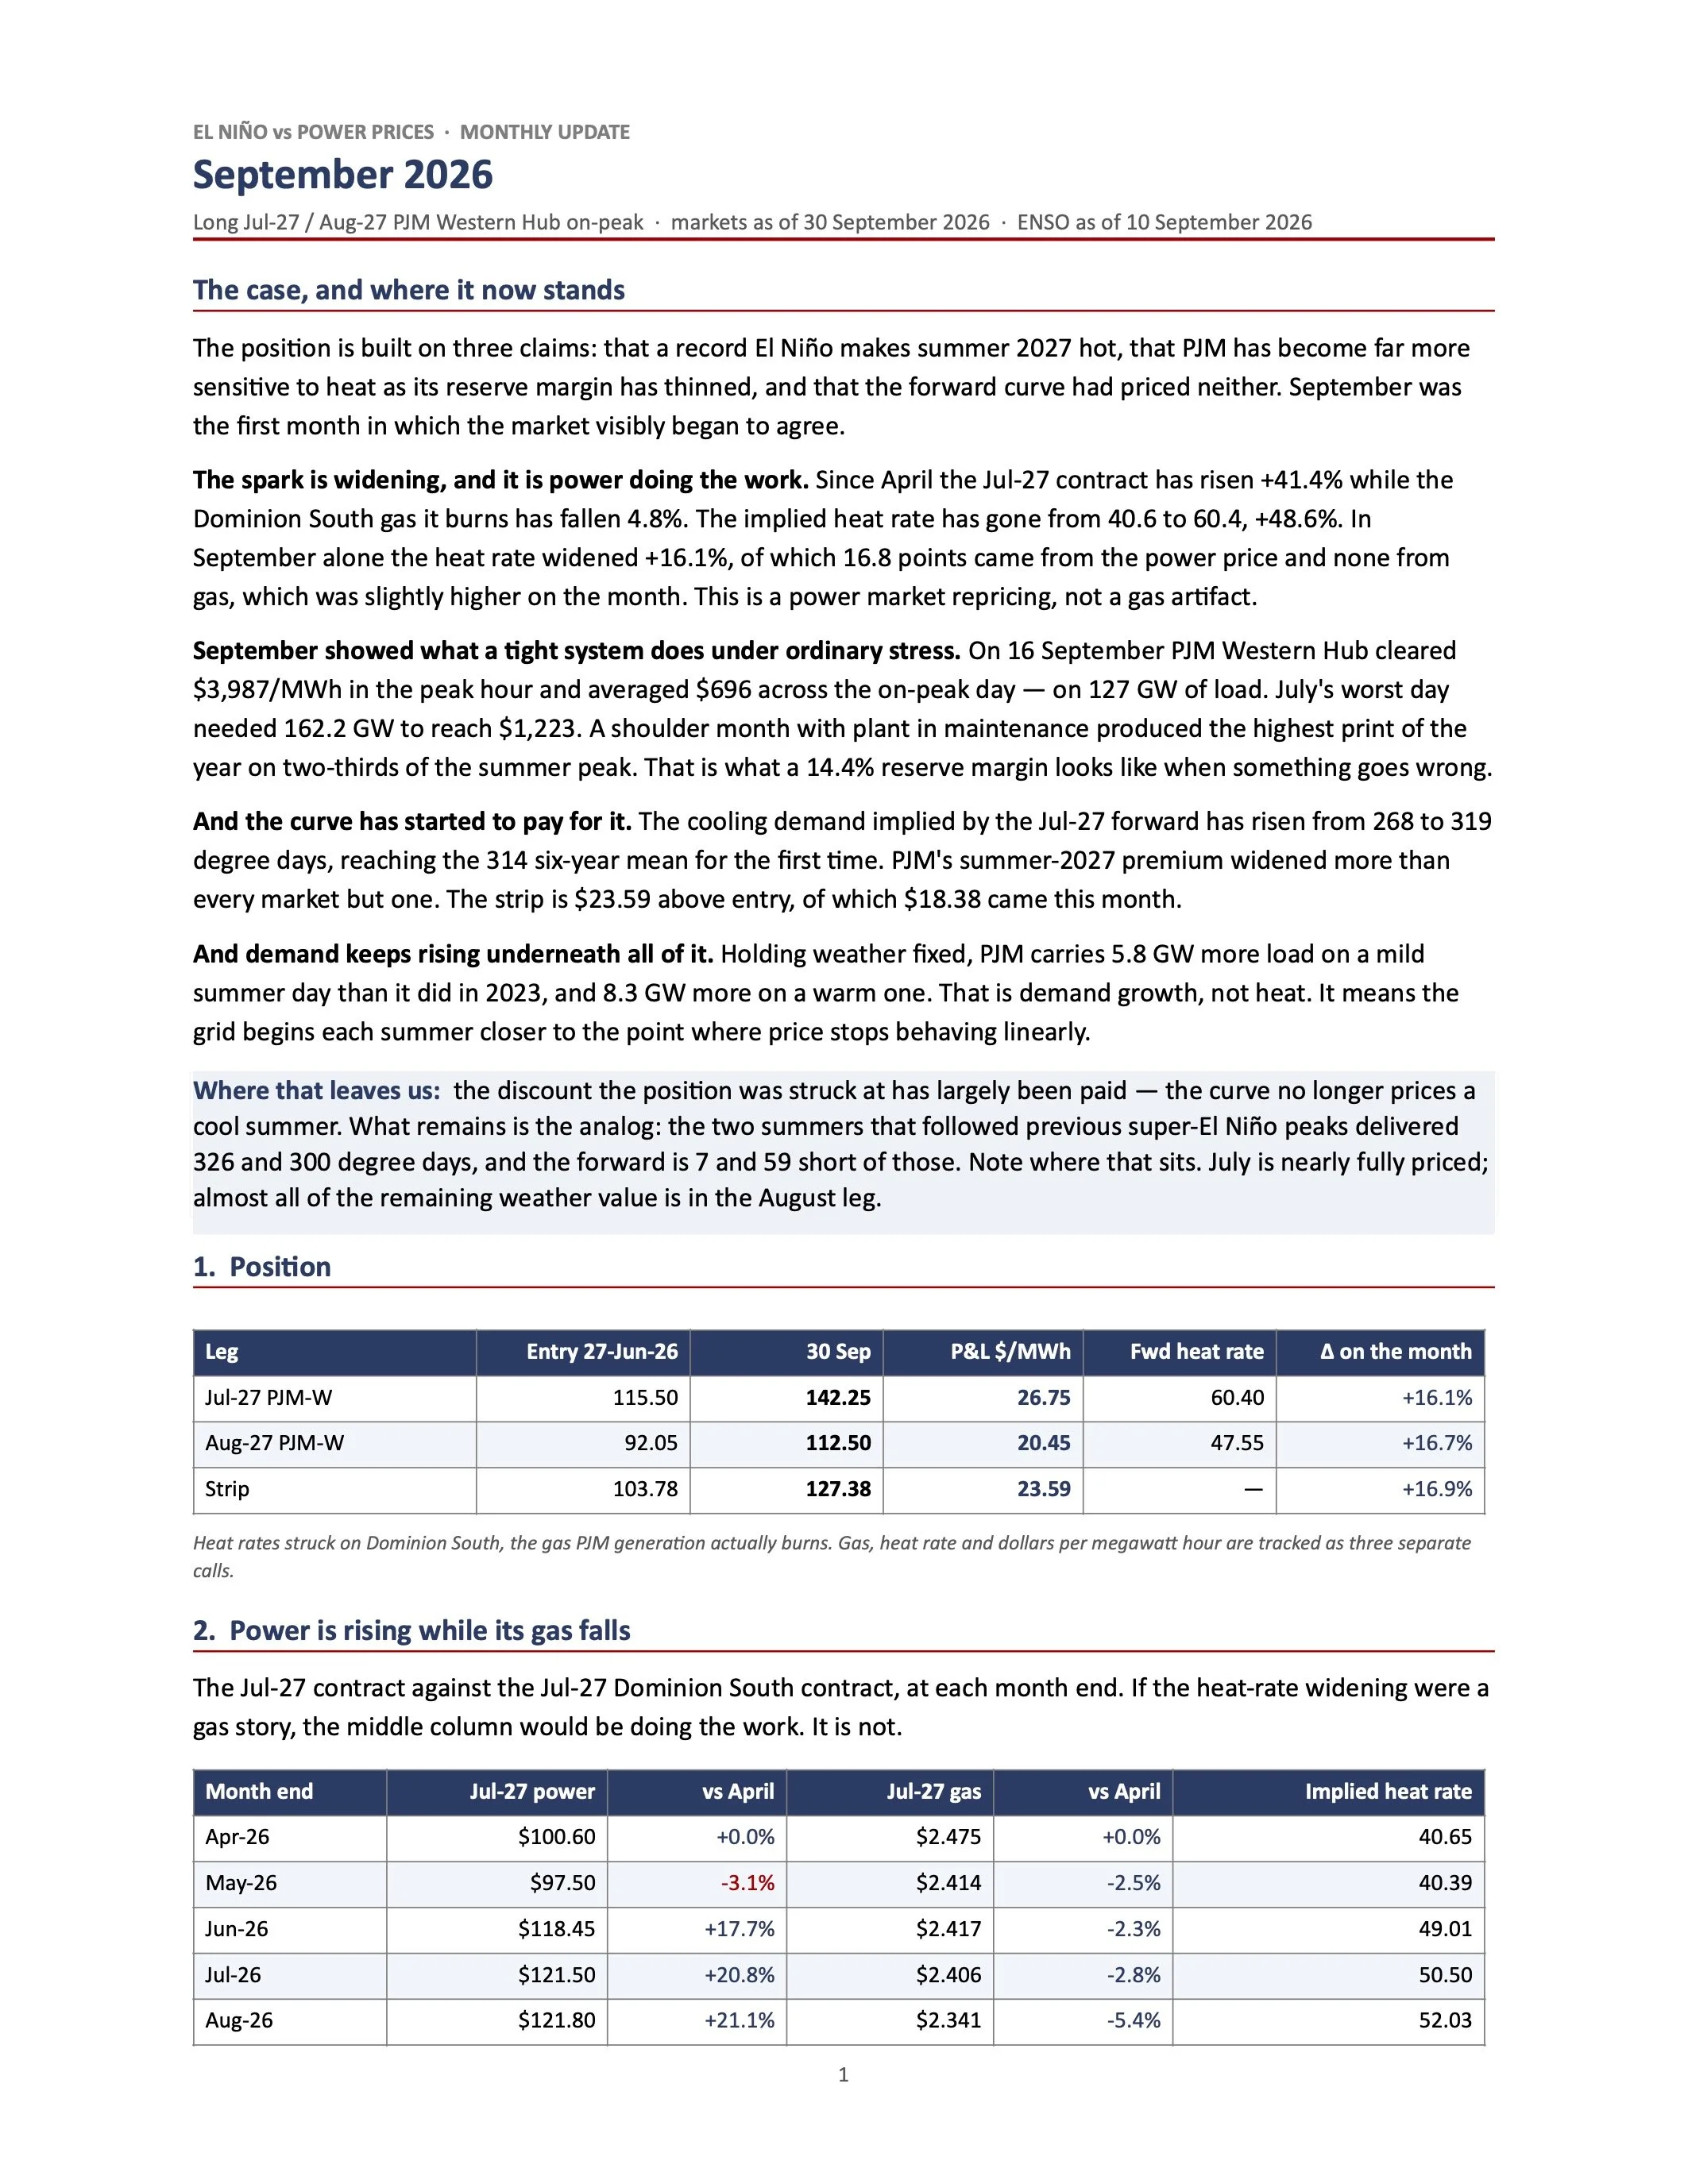
Power +41.4%, gas -4.8%, spark +48.6% in six months. Cheap gas and a Hghtening grid push the same direcHon here: the fuel that sets the price is gebng cheaper while the scarcity value of the megawac is rising. The posiHon is long that gap, not long gas.
Jul–Aug 2027 strip implied heat rate, each market struck against the gas its own generators burn. PJM separates from the group through the summer.
3. What September proved about fragility
September is a shoulder month. Load is moderate, and it is when generators take plant down for maintenance ahead of winter. It should be the quietest month of the summer. It was the most violent.
16 September cleared $3,987 an hour on 127 GW. August peaked at 144.7 GW and never printed a day above $148. July needed 162.2 GW — 35 GW more than September — to reach $1,223. The relaHonship between load and price is not a line; past a point it is a wall, and where that wall sits depends on how much plant is available, not on how hot it is. In September a good deal of plant was not available.
Month
On-peak days
Median day
Highest day
Days > $150
Days > $300
Peak load GW
Hours ≥150 GW
Pifsburgh CDD
June
22
$57
$288
2
0
149.7
0
160.1
July
23
$75
$482
5
4
162.2
35
301.9
August
21
$64
$148
0
0
144.7
0
217.8
September
22
$66
$696
4
2
152.4
3
147.2
2
Each point is one on-peak weekday: the day’s average price against its peak load. Note the ver7cal axis is logarithmic — the September cluster sits an order of magnitude above days of comparable load.
4. Demand is growing underneath the weather
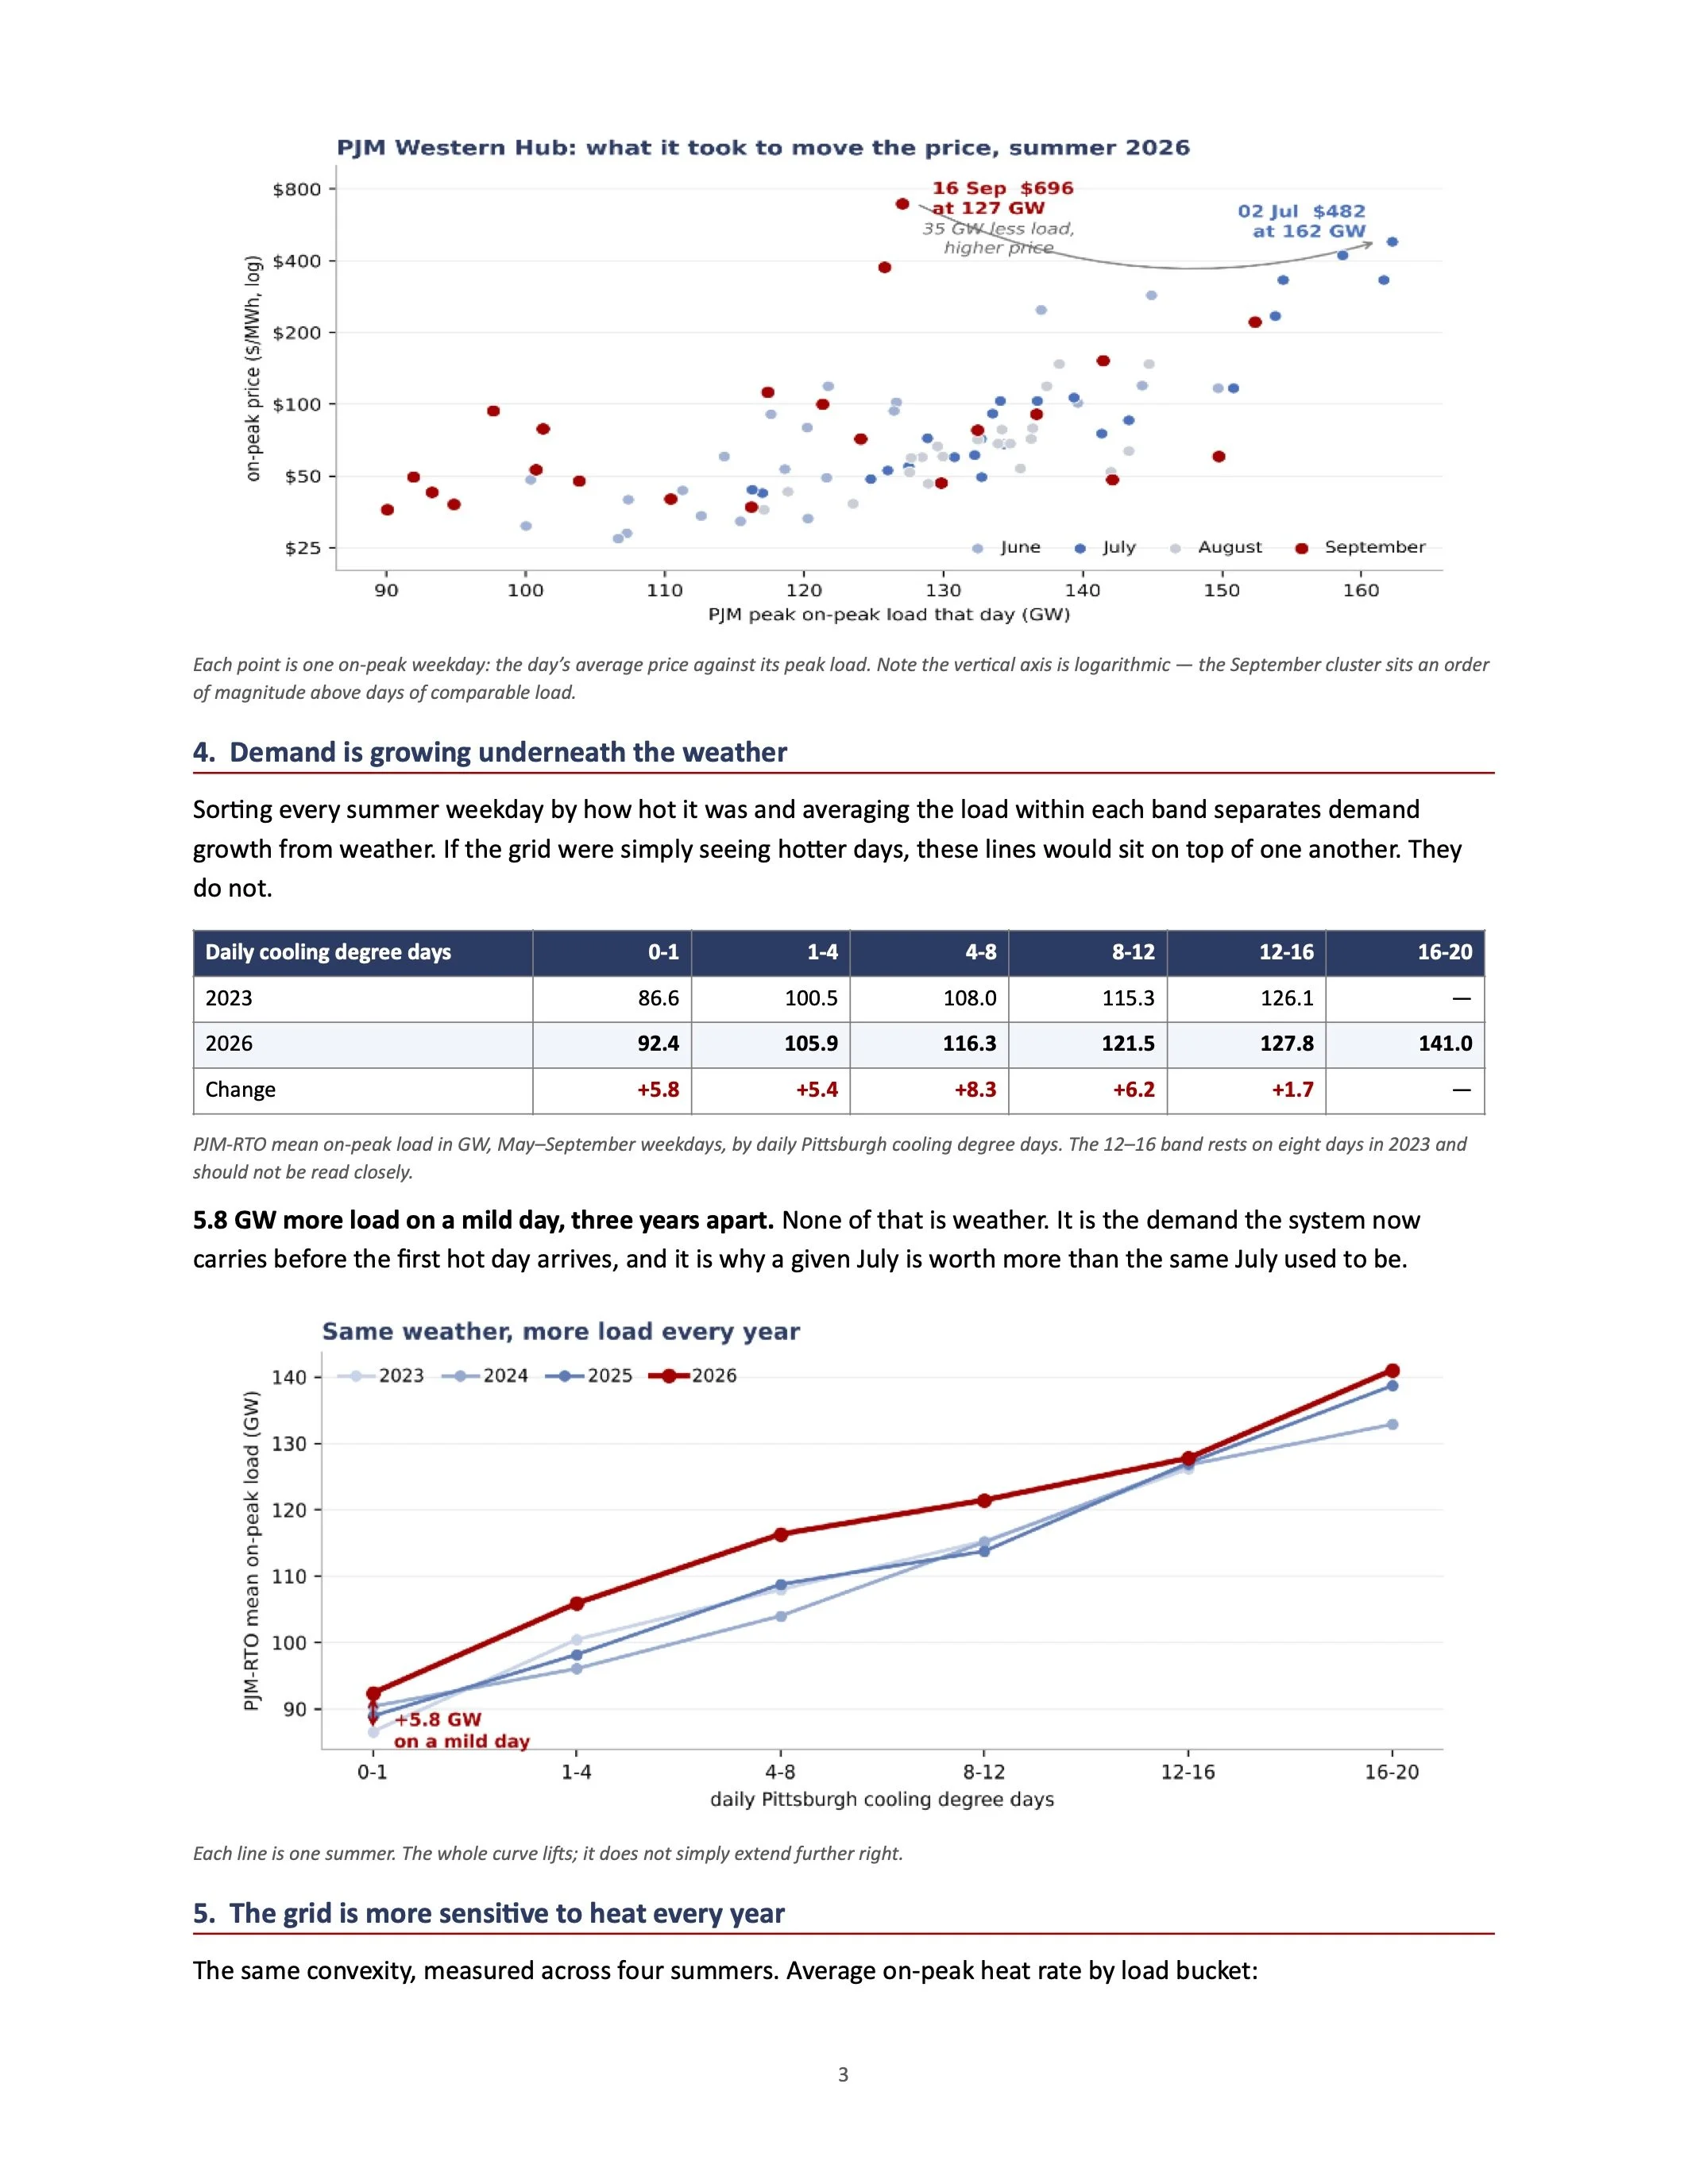
SorHng every summer weekday by how hot it was and averaging the load within each band separates demand growth from weather. If the grid were simply seeing hocer days, these lines would sit on top of one another. They do not.
PJM-RTO mean on-peak load in GW, May–September weekdays, by daily Pi@sburgh cooling degree days. The 12–16 band rests on eight days in 2023 and should not be read closely.
5.8 GW more load on a mild day, three years apart. None of that is weather. It is the demand the system now carries before the first hot day arrives, and it is why a given July is worth more than the same July used to be.
Each line is one summer. The whole curve liVs; it does not simply extend further right.
5. The grid is more sensiLve to heat every year
The same convexity, measured across four summers. Average on-peak heat rate by load bucket:
Daily cooling degree days
0-1
1-4
4-8
8-12
12-16
16-20
2023
86.6
100.5
108.0
115.3
126.1
—
2026
92.4
105.9
116.3
121.5
127.8
141.0
Change
+5.8
+5.4
+8.3
+6.2
+1.7
—
3
PJM load (GW)
2023
2024
2025
2026
110-120
15.2
18.8
14.0
20.8
120-130
20.4
22.6
17.8
30.0
130-140
26.7
35.2
25.3
43.5
140-150
29.1
52.4
45.0
81.3
150+
—
84.7
124.6
193.4
Mean on-peak heat rate by load bucket, summer hours, Henry Hub basis for comparability across years. 2026 par7al.
The same change expressed as a single number: regress each summer’s daily heat rate on that day’s cooling degree days, and the slope is what one addiHonal degree day is worth.
PJM Western Hub on-peak, struck on Dominion South, June–August, one fit per summer on a single degree-day conven7on.
Above 150 GW the 2026 market pays 193, against 125 in 2025 and 85 in 2024. Hours above 150 GW have gone 0 to 8 to 29 to 35 across the same four summers. The tail is both facer and more frequent. PJM's own capacity aucHon for the 2027/28 delivery year cleared at its administraHve ceiling, $333.44/MW-day, against an uncapped simulated price of $529.8 — procuring a 14.4% installed reserve margin against a 20% target. The shortage was not paid what it was worth, so licle new supply is coming by summer 2027.
6. What the forward curve is paying for
Running the Jul-27 and Aug-27 forward heat rates back through the current relaHonship between PJM heat rates and Picsburgh cooling degree days gives the weather the market is implicitly buying.
Pi@sburgh cooling degree days, base 65 °F. Six-year mean is 2011, 2016, 2019 and 2022–2024; post-super analog is the mean of 2016 and 2024, the summers following previous super-El Niño peaks. Rela7onship fi@ed on 66 days of summer 2026, R2 0.53.
Both legs have crossed their six-year means — Jul-27 from 268 to 319, Aug-27 from 199 to 241. The relaHonship used to invert them did not change this month, so the move is the market and not the measurement.
The remaining value is not where it was. Against the analog rather than the mean, July is 7 degree days short and August is 59. The two legs were entered as equals. They are no longer symmetric: on these benchmarks August carries roughly 8 Hmes the weather upside July does. July has largely been paid for; August has not.
Summer
2022
2023
2024
2025
2026
Heat rate points per degree day
0.79
1.35
1.91
2.61
5.12
Contract
Fwd heat rate
Implied CDD
Six-year mean
Gap
Post-super analog
Gap
Jul-27 PJM-W
60.40
319
314
+5
326
-7
Aug-27 PJM-W
47.55
241
248
-7
300
-59
Summer
July CDD
August CDD
2011
370
241
2016
325
344
2019
296
205
2022
295
230
2023
272
214
2024
326
255
Six-year mean
314
248
Post-super analog (2016, 2024)
326
300
Pi@sburgh, base 65 °F, calendar-aligned full months on one conven7on throughout. August 2011, 2016 and 2019 are scaled from 30-day totals and carry roughly ±5 degree days.
4
7. What summer 2027 is worth
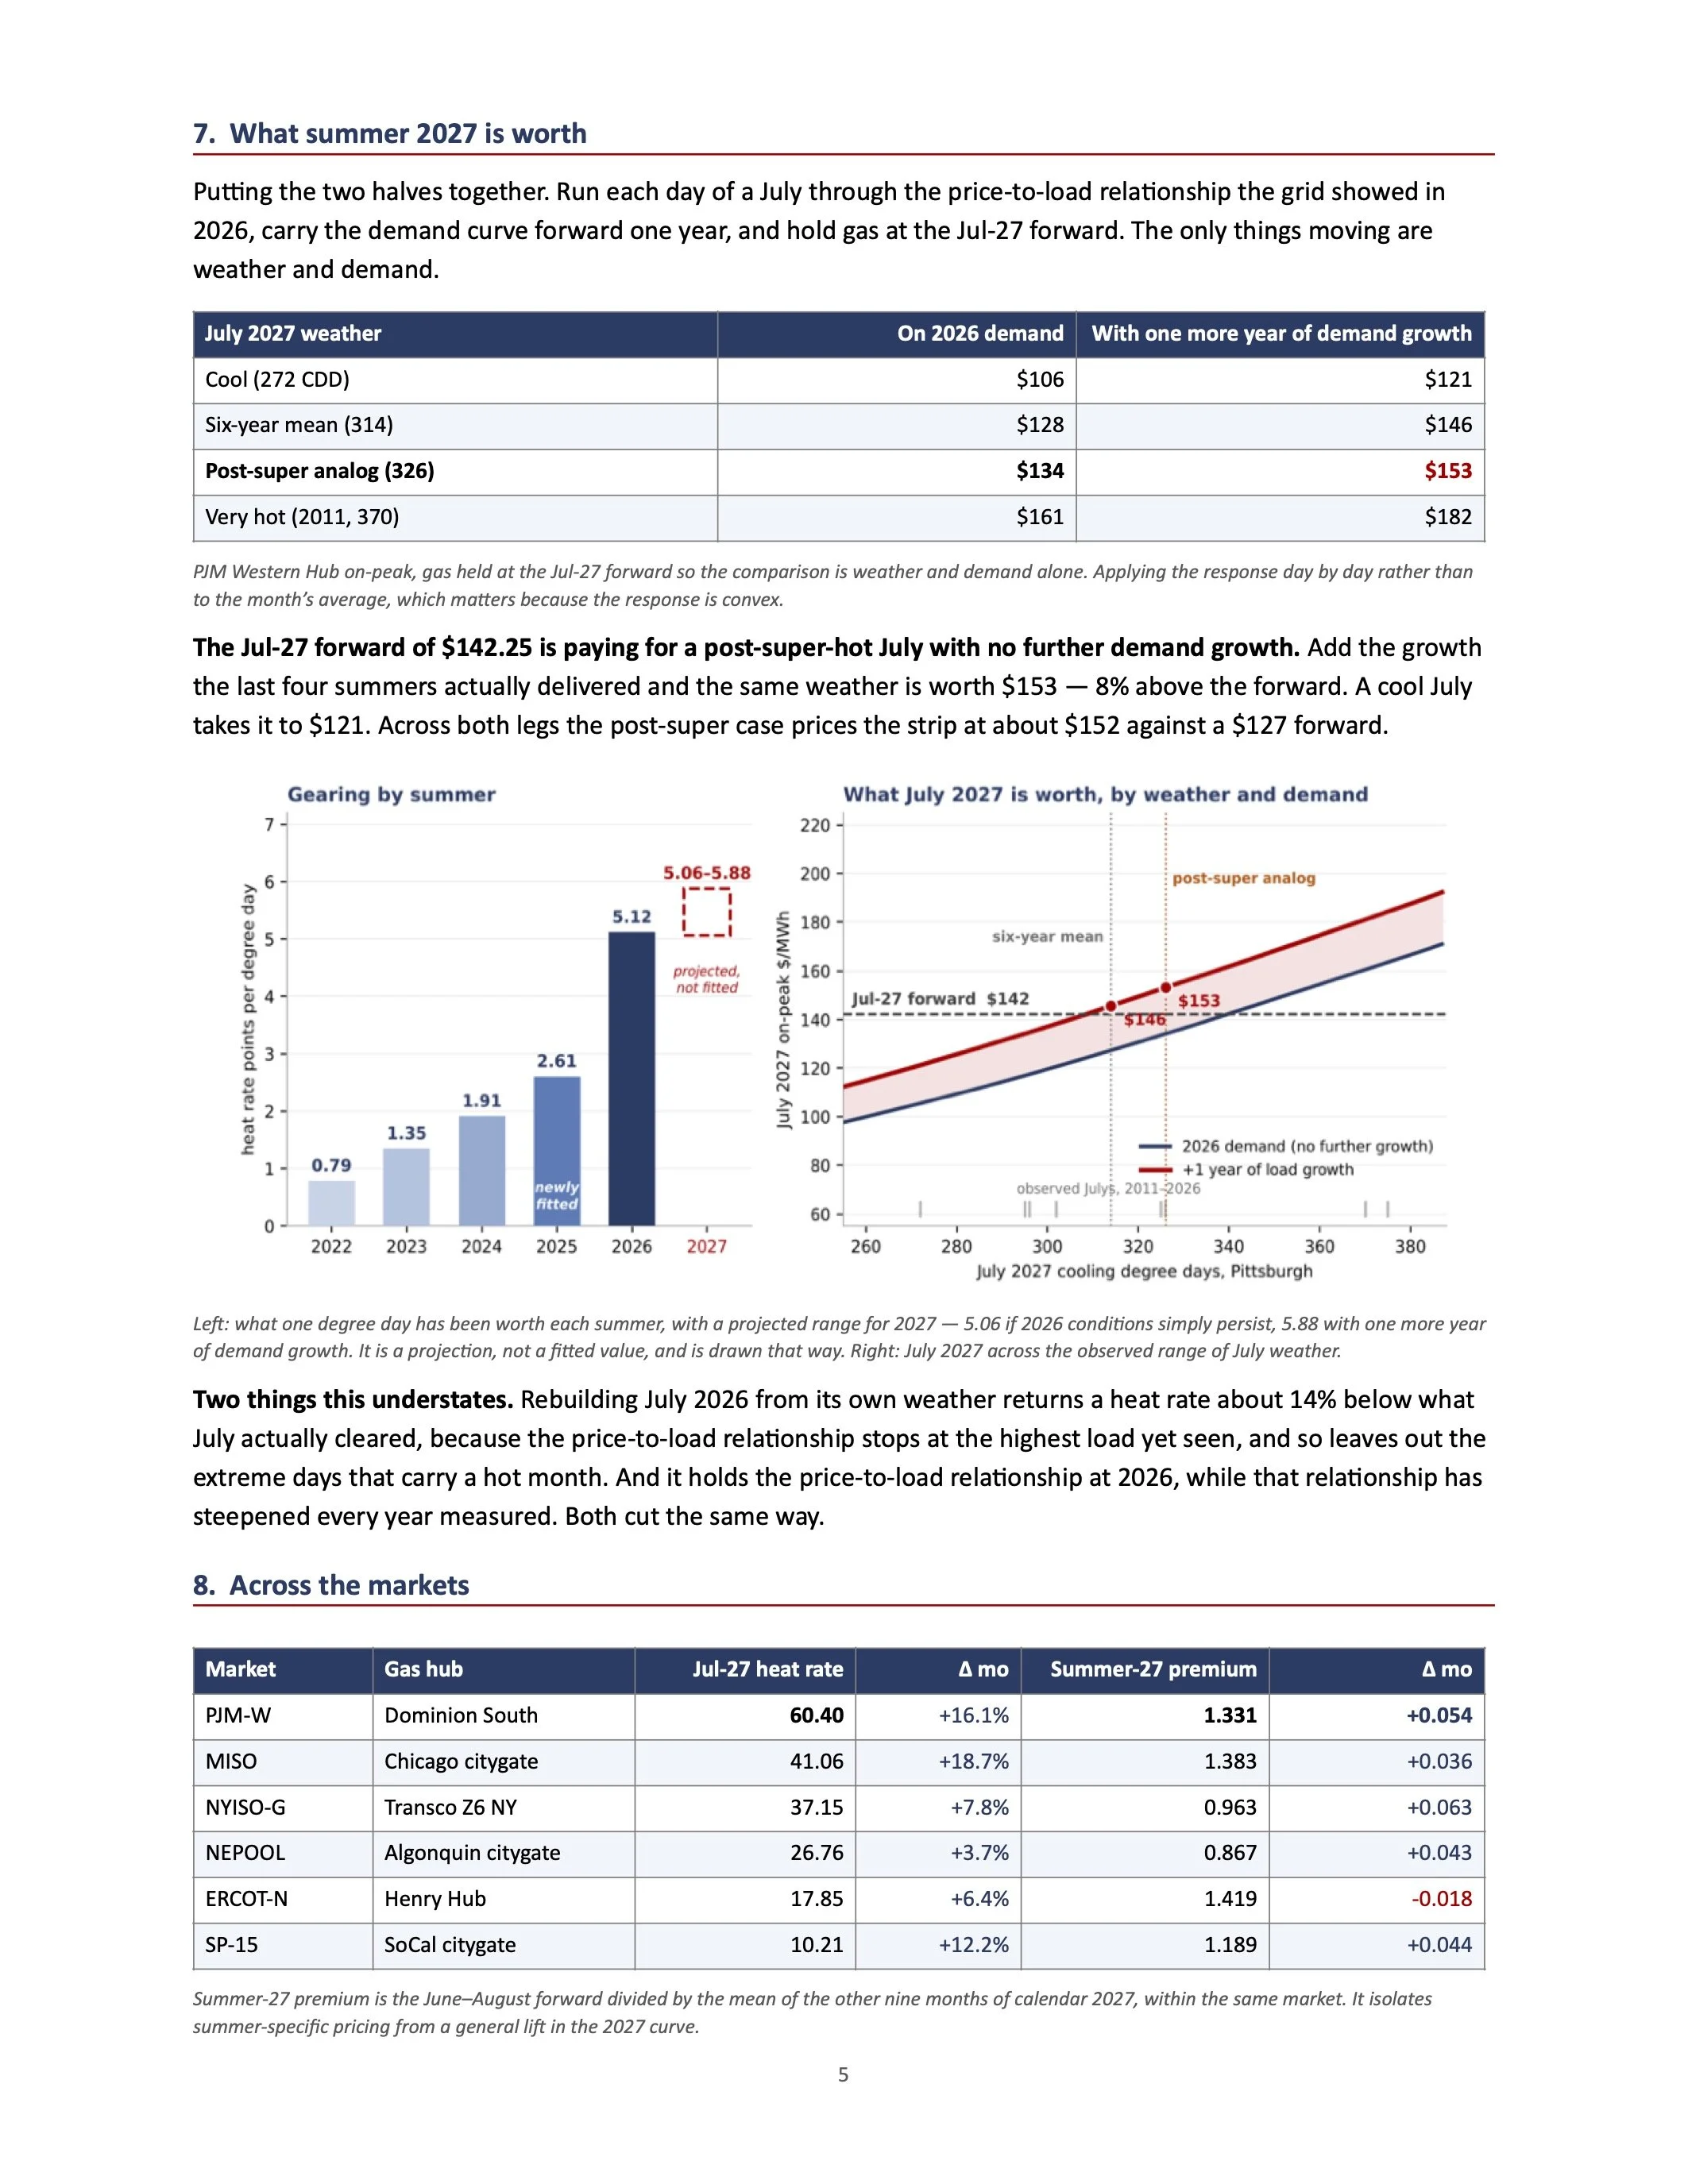
Pubng the two halves together. Run each day of a July through the price-to-load relaHonship the grid showed in 2026, carry the demand curve forward one year, and hold gas at the Jul-27 forward. The only things moving are weather and demand.
PJM Western Hub on-peak, gas held at the Jul-27 forward so the comparison is weather and demand alone. Applying the response day by day rather than to the month’s average, which ma@ers because the response is convex.
The Jul-27 forward of $142.25 is paying for a post-super-hot July with no further demand growth. Add the growth the last four summers actually delivered and the same weather is worth $153 — 8% above the forward. A cool July takes it to $121. Across both legs the post-super case prices the strip at about $152 against a $127 forward.
LeV: what one degree day has been worth each summer, with a projected range for 2027 — 5.06 if 2026 condi7ons simply persist, 5.88 with one more year of demand growth. It is a projec7on, not a fi@ed value, and is drawn that way. Right: July 2027 across the observed range of July weather.
Two things this understates. Rebuilding July 2026 from its own weather returns a heat rate about 14% below what July actually cleared, because the price-to-load relaHonship stops at the highest load yet seen, and so leaves out the extreme days that carry a hot month. And it holds the price-to-load relaHonship at 2026, while that relaHonship has steepened every year measured. Both cut the same way.
8. Across the markets
July 2027 weather
On 2026 demand
With one more year of demand growth
Cool (272 CDD)
$106
$121
Six-year mean (314)
$128
$146
Post-super analog (326)
$134
$153
Very hot (2011, 370)
$161
$182
Market
Gas hub
Jul-27 heat rate
Δ mo
Summer-27 premium
Δ mo
PJM-W
Dominion South
60.40
+16.1%
1.331
+0.054
MISO
Chicago citygate
41.06
+18.7%
1.383
+0.036
NYISO-G
Transco Z6 NY
37.15
+7.8%
0.963
+0.063
NEPOOL
Algonquin citygate
26.76
+3.7%
0.867
+0.043
ERCOT-N
Henry Hub
17.85
+6.4%
1.419
-0.018
SP-15
SoCal citygate
10.21
+12.2%
1.189
+0.044
Summer-27 premium is the June–August forward divided by the mean of the other nine months of calendar 2027, within the same market. It isolates summer-specific pricing from a general liV in the 2027 curve.
5
PJM remains the outlier at 60.4, and its summer premium widened 0.054 to 1.331 — the second largest move of the six. The honest qualificaHon: five of the six markets widened this month, so part of what we are seeing is a general bid for summer 2027 rather than something PJM-specific. One month of PJM outperformance inside a broad move is encouraging rather than conclusive. A second consecuHve month would be the thing that secles it, and that is the single most informaHve number in the October cut.
9. The El Niño
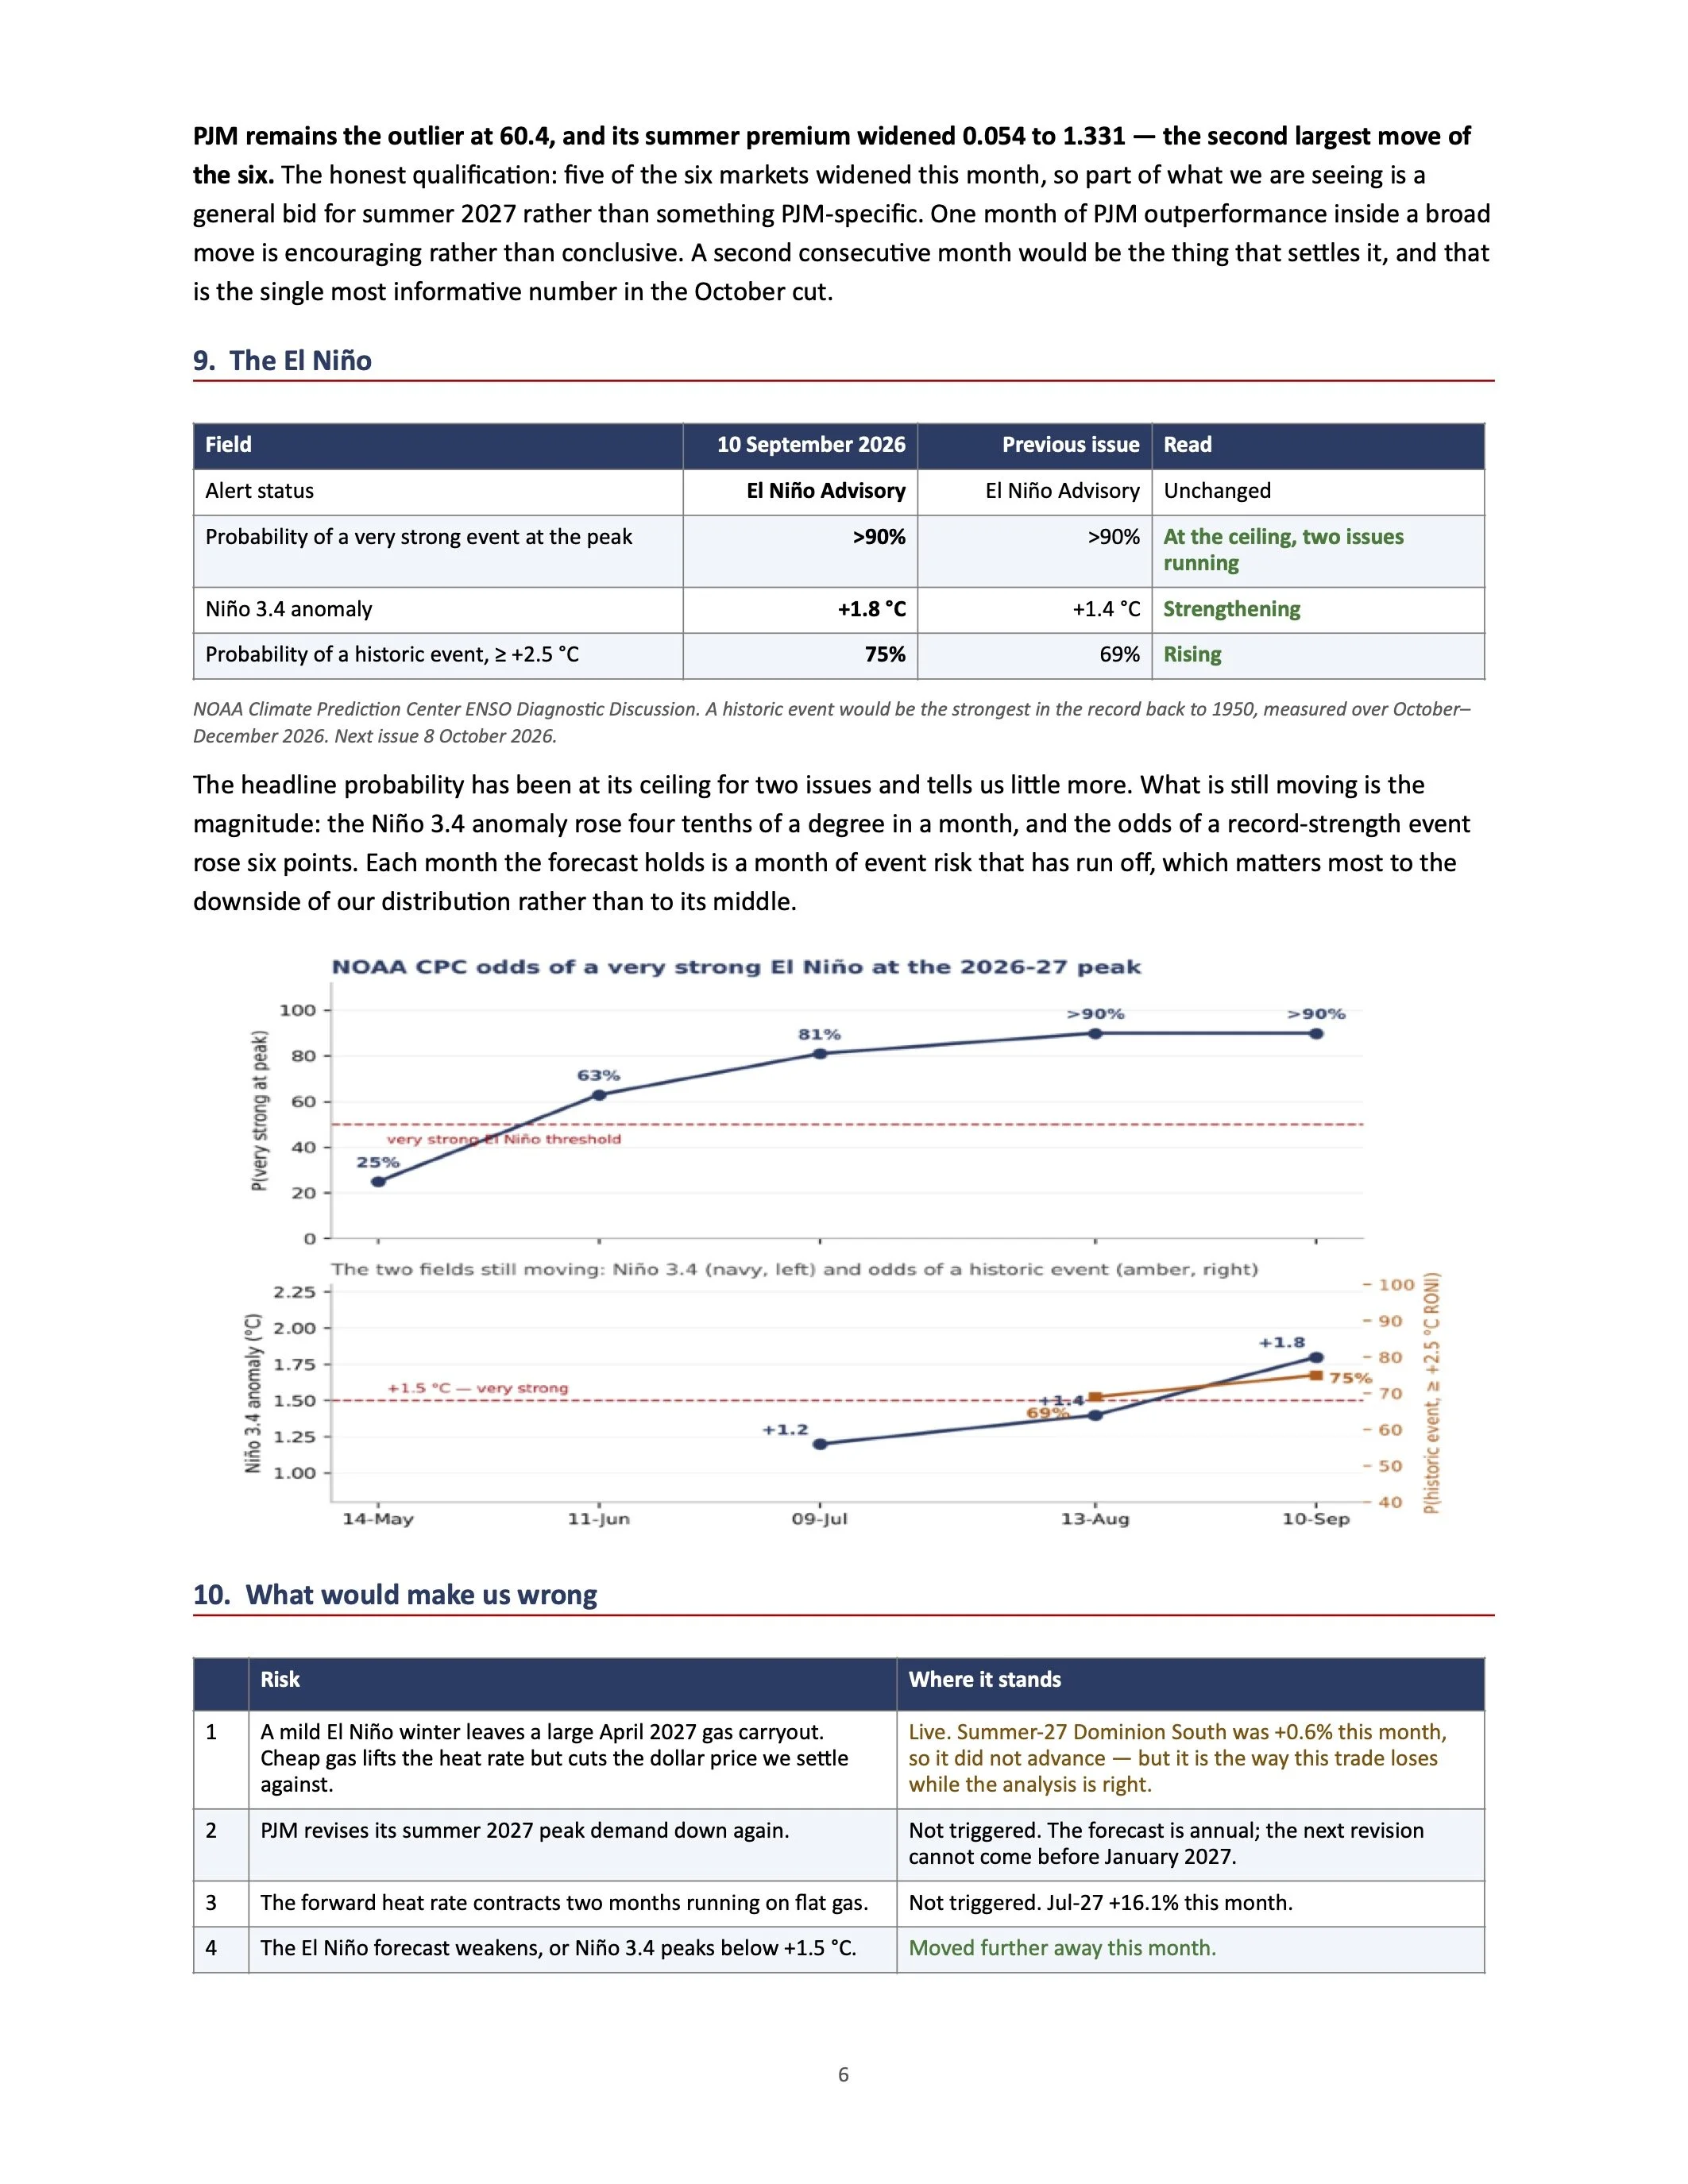
NOAA Climate Predic7on Center ENSO Diagnos7c Discussion. A historic event would be the strongest in the record back to 1950, measured over October– December 2026. Next issue 8 October 2026.
The headline probability has been at its ceiling for two issues and tells us licle more. What is sHll moving is the magnitude: the Niño 3.4 anomaly rose four tenths of a degree in a month, and the odds of a record-strength event rose six points. Each month the forecast holds is a month of event risk that has run off, which macers most to the downside of our distribuHon rather than to its middle.
10. What would make us wrong
Field
10 September 2026
Previous issue
Read
Alert status
El Niño Advisory
El Niño Advisory
Unchanged
Probability of a very strong event at the peak
>90%
>90%
At the ceiling, two issues running
Niño 3.4 anomaly
+1.8 °C
+1.4 °C
Strengthening
Probability of a historic event, ≥ +2.5 °C
75%
69%
Rising
Risk
Where it stands
1
A mild El Niño winter leaves a large April 2027 gas carryout. Cheap gas lirs the heat rate but cuts the dollar price we secle against.
Live. Summer-27 Dominion South was +0.6% this month, so it did not advance — but it is the way this trade loses while the analysis is right.
2
PJM revises its summer 2027 peak demand down again.
Not triggered. The forecast is annual; the next revision cannot come before January 2027.
3
The forward heat rate contracts two months running on flat gas.
Not triggered. Jul-27 +16.1% this month.
4
The El Niño forecast weakens, or Niño 3.4 peaks below +1.5 °C.
Moved further away this month.
6
Risk Where it stands
5
Solar and storage erode the price tail, as they have in Texas.
Not visible in PJM — September produced 2 days above $300. It is visible in ERCOT, the only market whose summer-27 premium fell this month.
11. What to watch
Three things before the next update. Whether PJM's summer premium finishes in the top two a second month, which is what separates a PJM-specific repricing from a general bid for summer 2027. The 8 October 2026 CPC discussion, the first read on whether the anomaly keeps climbing past +1.8 °C into the winter peak. And the shape of winter itself — a mild January, which is what this El Niño implies, builds the gas carryout that is the main risk to the dollar leg even as it supports the weather case.
The quesLon we asked in June — does the curve price a normal summer — has been answered. The quesLon now is whether it prices the analog, and that quesLon is really about August.
Prices as of 30 September 2026. PJM Western Hub on-peak, 5×16 weekdays. September realized heat rate struck on Dominion South spot, which averaged $1.369 against Henry Hub at $2.955; on a Henry Hub basis the same month is 39.7 rather than 85.7, and the Appalachian basis has widened through the year. The September price and weather observa7ons in sec7on 3 are unaffected by basis.
7
