
CNIC FUNDS Power Is Not Gas | October 2026
WHITE PAPER | OCTOBER 2026
Power Is Not Gas
Electricity and natural gas prices are separa1ng in both the spot and futures markets
ExecuAve Summary
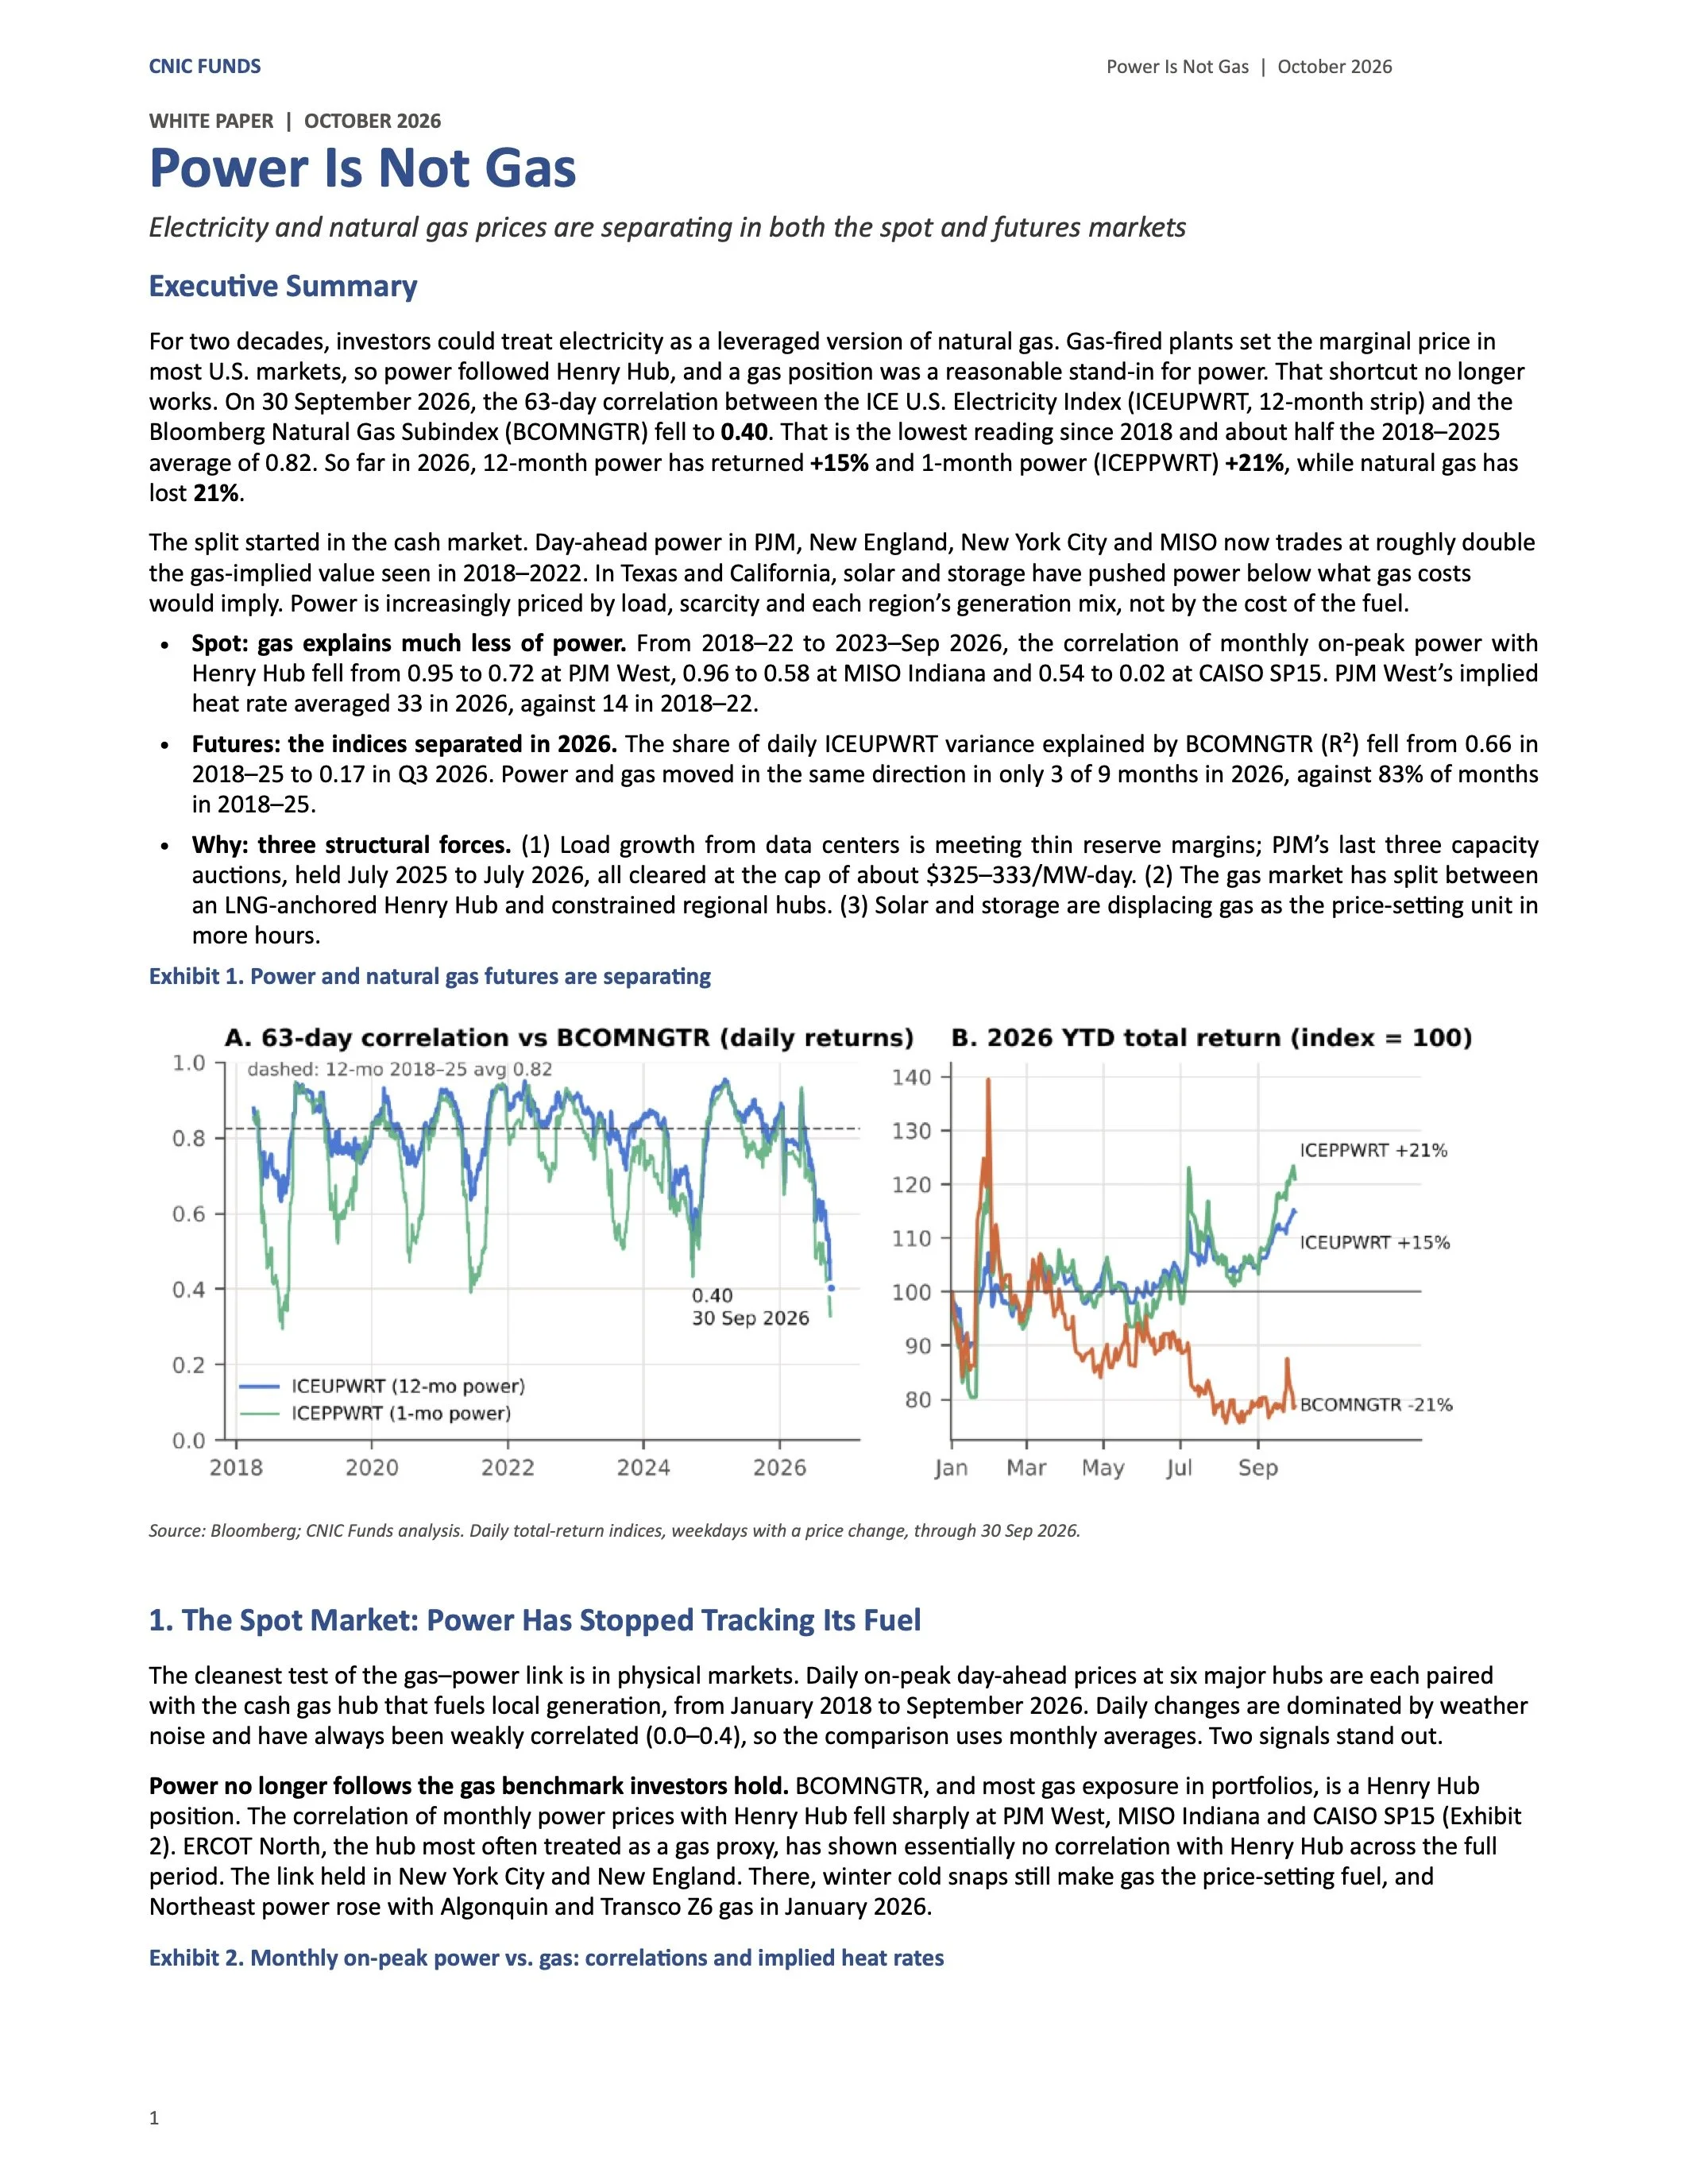
For two decades, investors could treat electricity as a leveraged version of natural gas. Gas-fired plants set the marginal price in most U.S. markets, so power followed Henry Hub, and a gas posiIon was a reasonable stand-in for power. That shortcut no longer works. On 30 September 2026, the 63-day correlaIon between the ICE U.S. Electricity Index (ICEUPWRT, 12-month strip) and the Bloomberg Natural Gas Subindex (BCOMNGTR) fell to 0.40. That is the lowest reading since 2018 and about half the 2018–2025 average of 0.82. So far in 2026, 12-month power has returned +15% and 1-month power (ICEPPWRT) +21%, while natural gas has lost 21%.
The split started in the cash market. Day-ahead power in PJM, New England, New York City and MISO now trades at roughly double the gas-implied value seen in 2018–2022. In Texas and California, solar and storage have pushed power below what gas costs would imply. Power is increasingly priced by load, scarcity and each region’s generaIon mix, not by the cost of the fuel.
• Spot: gas explains much less of power. From 2018–22 to 2023–Sep 2026, the correlaIon of monthly on-peak power with Henry Hub fell from 0.95 to 0.72 at PJM West, 0.96 to 0.58 at MISO Indiana and 0.54 to 0.02 at CAISO SP15. PJM West’s implied heat rate averaged 33 in 2026, against 14 in 2018–22.
• Futures: the indices separated in 2026. The share of daily ICEUPWRT variance explained by BCOMNGTR (R2) fell from 0.66 in 2018–25 to 0.17 in Q3 2026. Power and gas moved in the same direcIon in only 3 of 9 months in 2026, against 83% of months in 2018–25.
• Why: three structural forces. (1) Load growth from data centers is meeIng thin reserve margins; PJM’s last three capacity aucIons, held July 2025 to July 2026, all cleared at the cap of about $325–333/MW-day. (2) The gas market has split between an LNG-anchored Henry Hub and constrained regional hubs. (3) Solar and storage are displacing gas as the price-sehng unit in more hours.
Exhibit 1. Power and natural gas futures are separaAng
Source: Bloomberg; CNIC Funds analysis. Daily total-return indices, weekdays with a price change, through 30 Sep 2026.
1. The Spot Market: Power Has Stopped Tracking Its Fuel
The cleanest test of the gas–power link is in physical markets. Daily on-peak day-ahead prices at six major hubs are each paired with the cash gas hub that fuels local generaIon, from January 2018 to September 2026. Daily changes are dominated by weather noise and have always been weakly correlated (0.0–0.4), so the comparison uses monthly averages. Two signals stand out.
Power no longer follows the gas benchmark investors hold. BCOMNGTR, and most gas exposure in porjolios, is a Henry Hub posiIon. The correlaIon of monthly power prices with Henry Hub fell sharply at PJM West, MISO Indiana and CAISO SP15 (Exhibit 2). ERCOT North, the hub most oken treated as a gas proxy, has shown essenIally no correlaIon with Henry Hub across the full period. The link held in New York City and New England. There, winter cold snaps sIll make gas the price-sehng fuel, and Northeast power rose with Algonquin and Transco Z6 gas in January 2026.
Exhibit 2. Monthly on-peak power vs. gas: correlaAons and implied heat rates
1
CNIC FUNDS Power Is Not Gas | October 2026
Power hub / local gas hub
Corr. w/ local gas 2018–22
Corr. w/ local gas 2023–26
Corr. w/ Henry Hub 2018–22
Corr. w/ Henry Hub 2023–26
Heat rate 2018–22
Heat rate 2026 YTD
PJM West / Tetco M3
0.83
0.67
0.95
0.72
14
33
ERCOT North / Henry Hub
0.13
-0.02
0.13
-0.02
22
10
CAISO SP15 / SoCal CG
0.92
0.87
0.54
0.02
11
7
ISO-NE Mass Hub / Algonquin
0.93
0.71
0.70
0.81
10
27
NYISO Zone J / Transco Z6 NY
0.91
0.91
0.80
0.86
14
24
MISO Indiana / Chicago CG
0.96
0.57
0.96
0.58
13
23
Source: Bloomberg (day-ahead on-peak LMPs; cash gas); CNIC Funds analysis. Monthly averages of daily prices; 2023–26 runs through Sep 2026. Heat rate = power ($/MWh) ÷ local gas ($/MMBtu). Shaded columns = recent period.
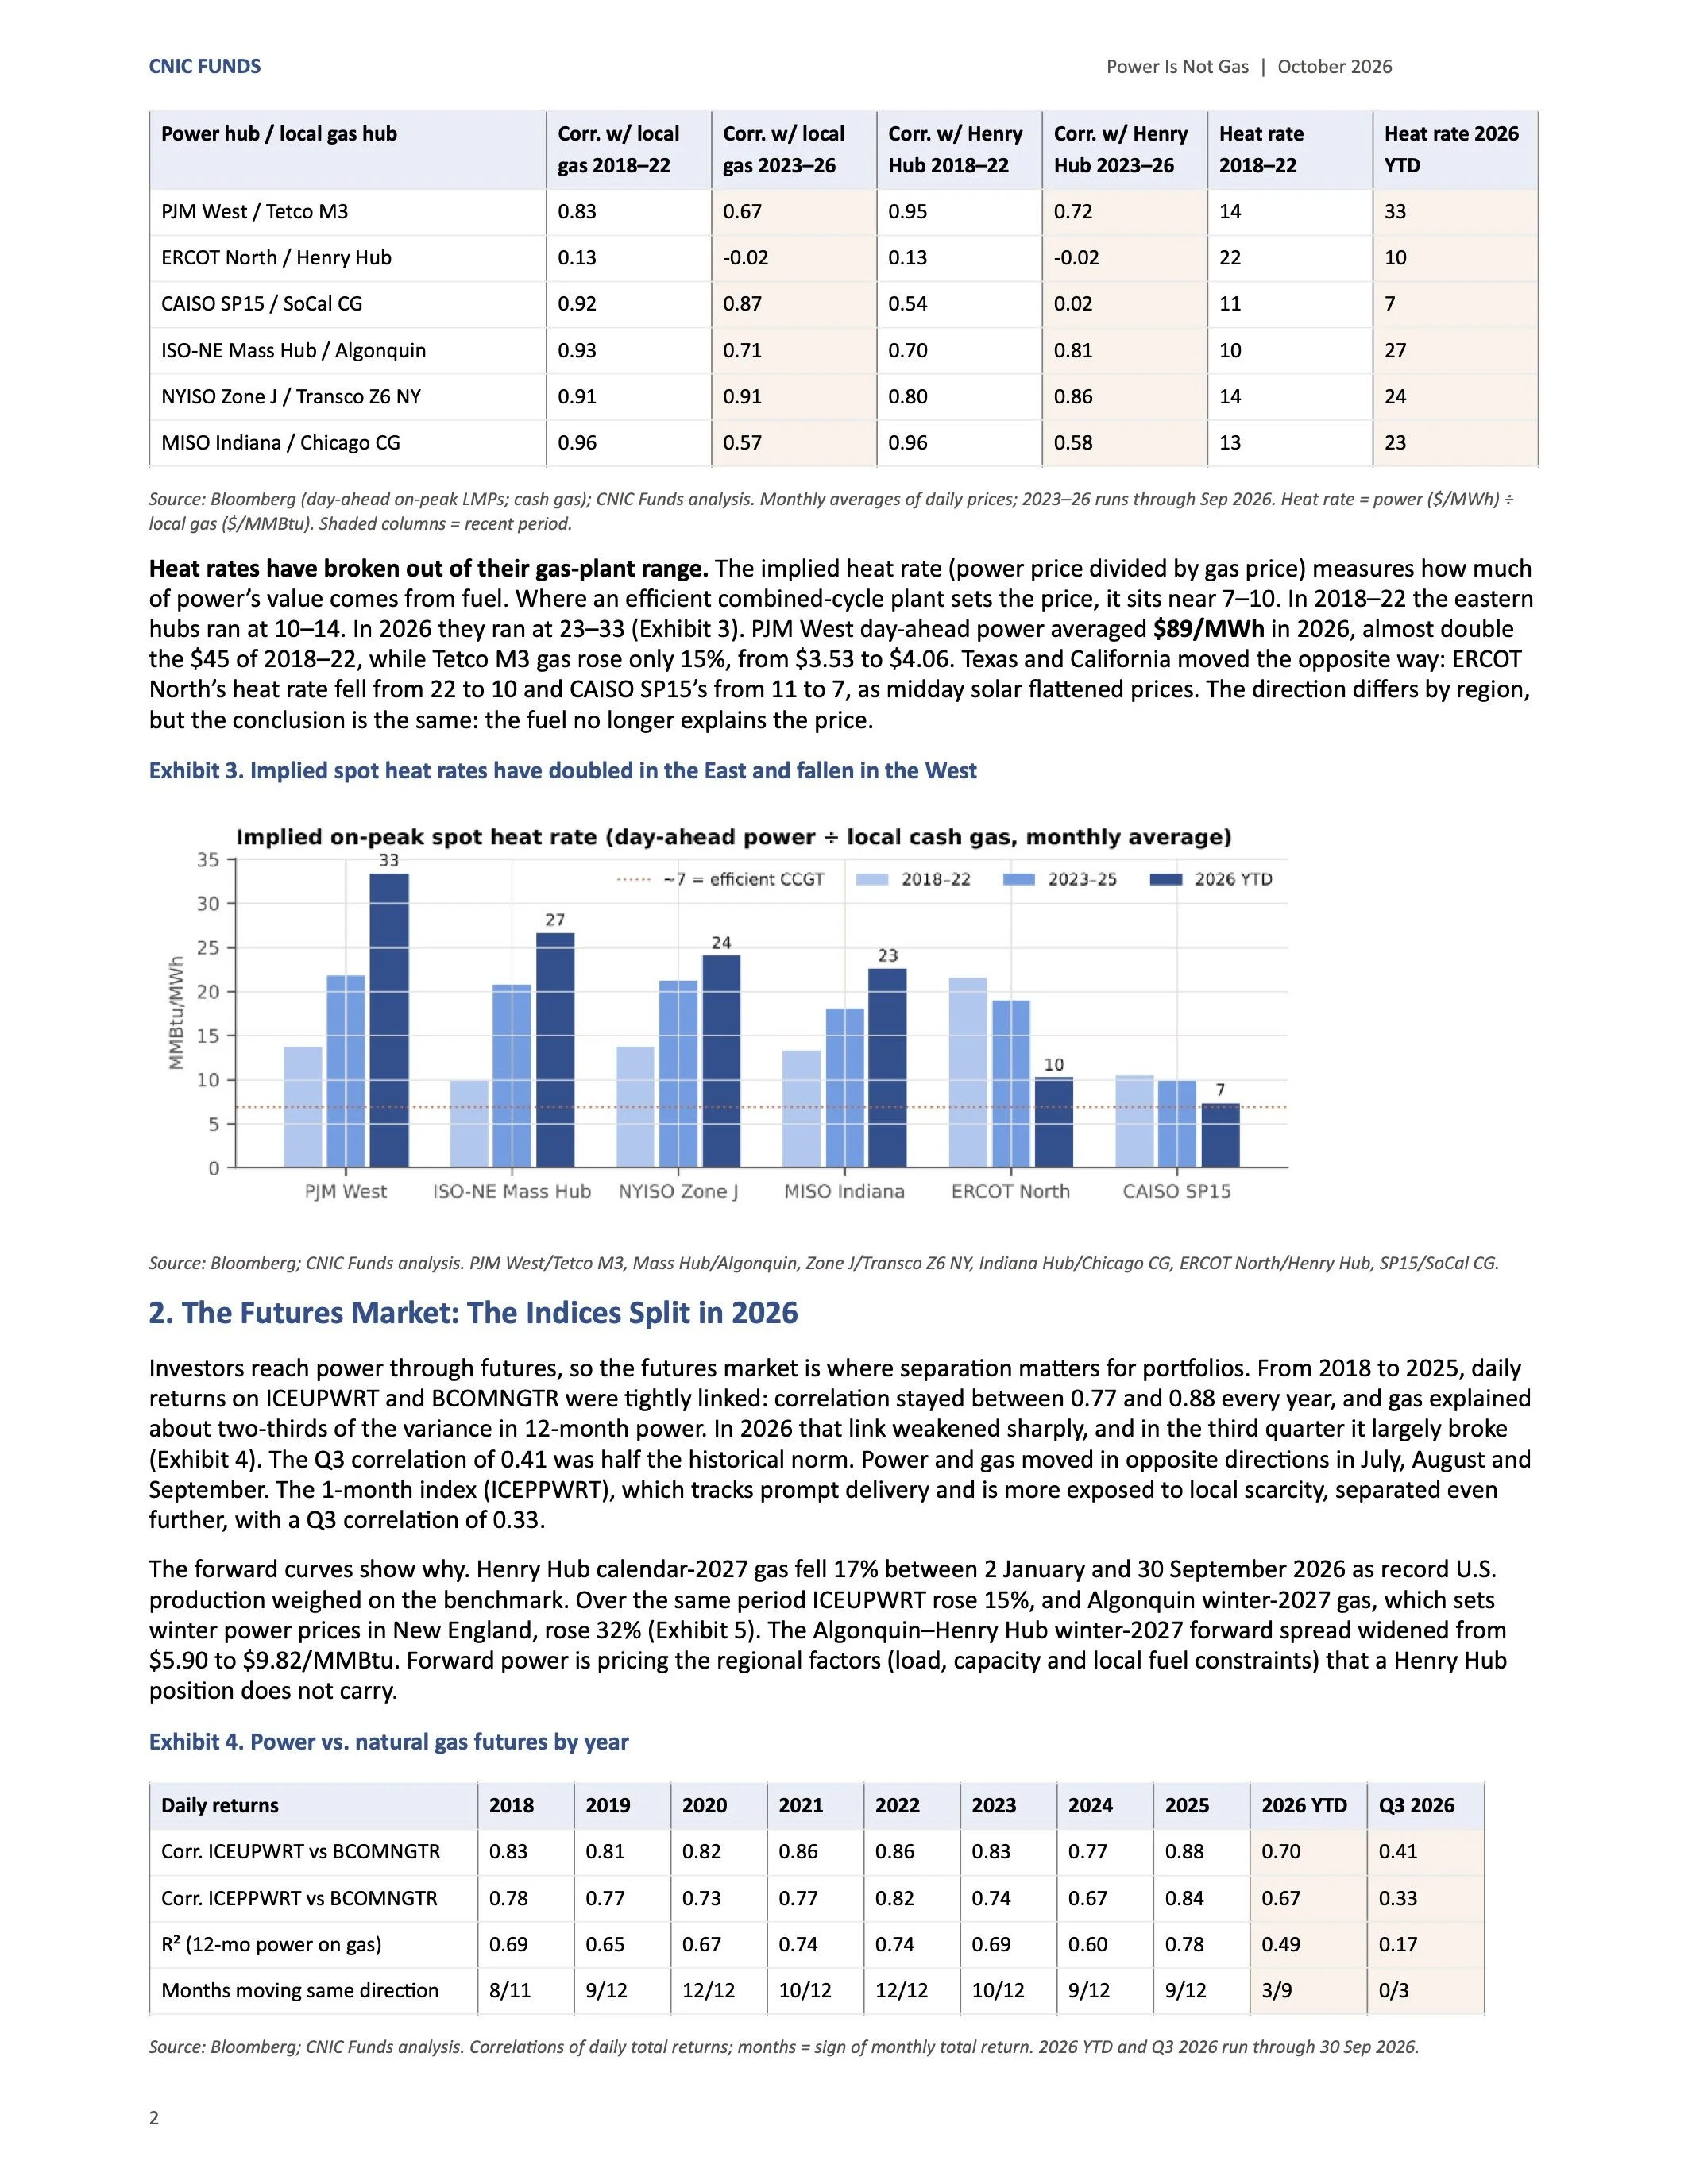
Heat rates have broken out of their gas-plant range. The implied heat rate (power price divided by gas price) measures how much of power’s value comes from fuel. Where an efficient combined-cycle plant sets the price, it sits near 7–10. In 2018–22 the eastern hubs ran at 10–14. In 2026 they ran at 23–33 (Exhibit 3). PJM West day-ahead power averaged $89/MWh in 2026, almost double the $45 of 2018–22, while Tetco M3 gas rose only 15%, from $3.53 to $4.06. Texas and California moved the opposite way: ERCOT North’s heat rate fell from 22 to 10 and CAISO SP15’s from 11 to 7, as midday solar flaqened prices. The direcIon differs by region, but the conclusion is the same: the fuel no longer explains the price.
Exhibit 3. Implied spot heat rates have doubled in the East and fallen in the West
Source: Bloomberg; CNIC Funds analysis. PJM West/Tetco M3, Mass Hub/Algonquin, Zone J/Transco Z6 NY, Indiana Hub/Chicago CG, ERCOT North/Henry Hub, SP15/SoCal CG.
2. The Futures Market: The Indices Split in 2026
Investors reach power through futures, so the futures market is where separaIon maqers for porjolios. From 2018 to 2025, daily returns on ICEUPWRT and BCOMNGTR were Ightly linked: correlaIon stayed between 0.77 and 0.88 every year, and gas explained about two-thirds of the variance in 12-month power. In 2026 that link weakened sharply, and in the third quarter it largely broke (Exhibit 4). The Q3 correlaIon of 0.41 was half the historical norm. Power and gas moved in opposite direcIons in July, August and September. The 1-month index (ICEPPWRT), which tracks prompt delivery and is more exposed to local scarcity, separated even further, with a Q3 correlaIon of 0.33.
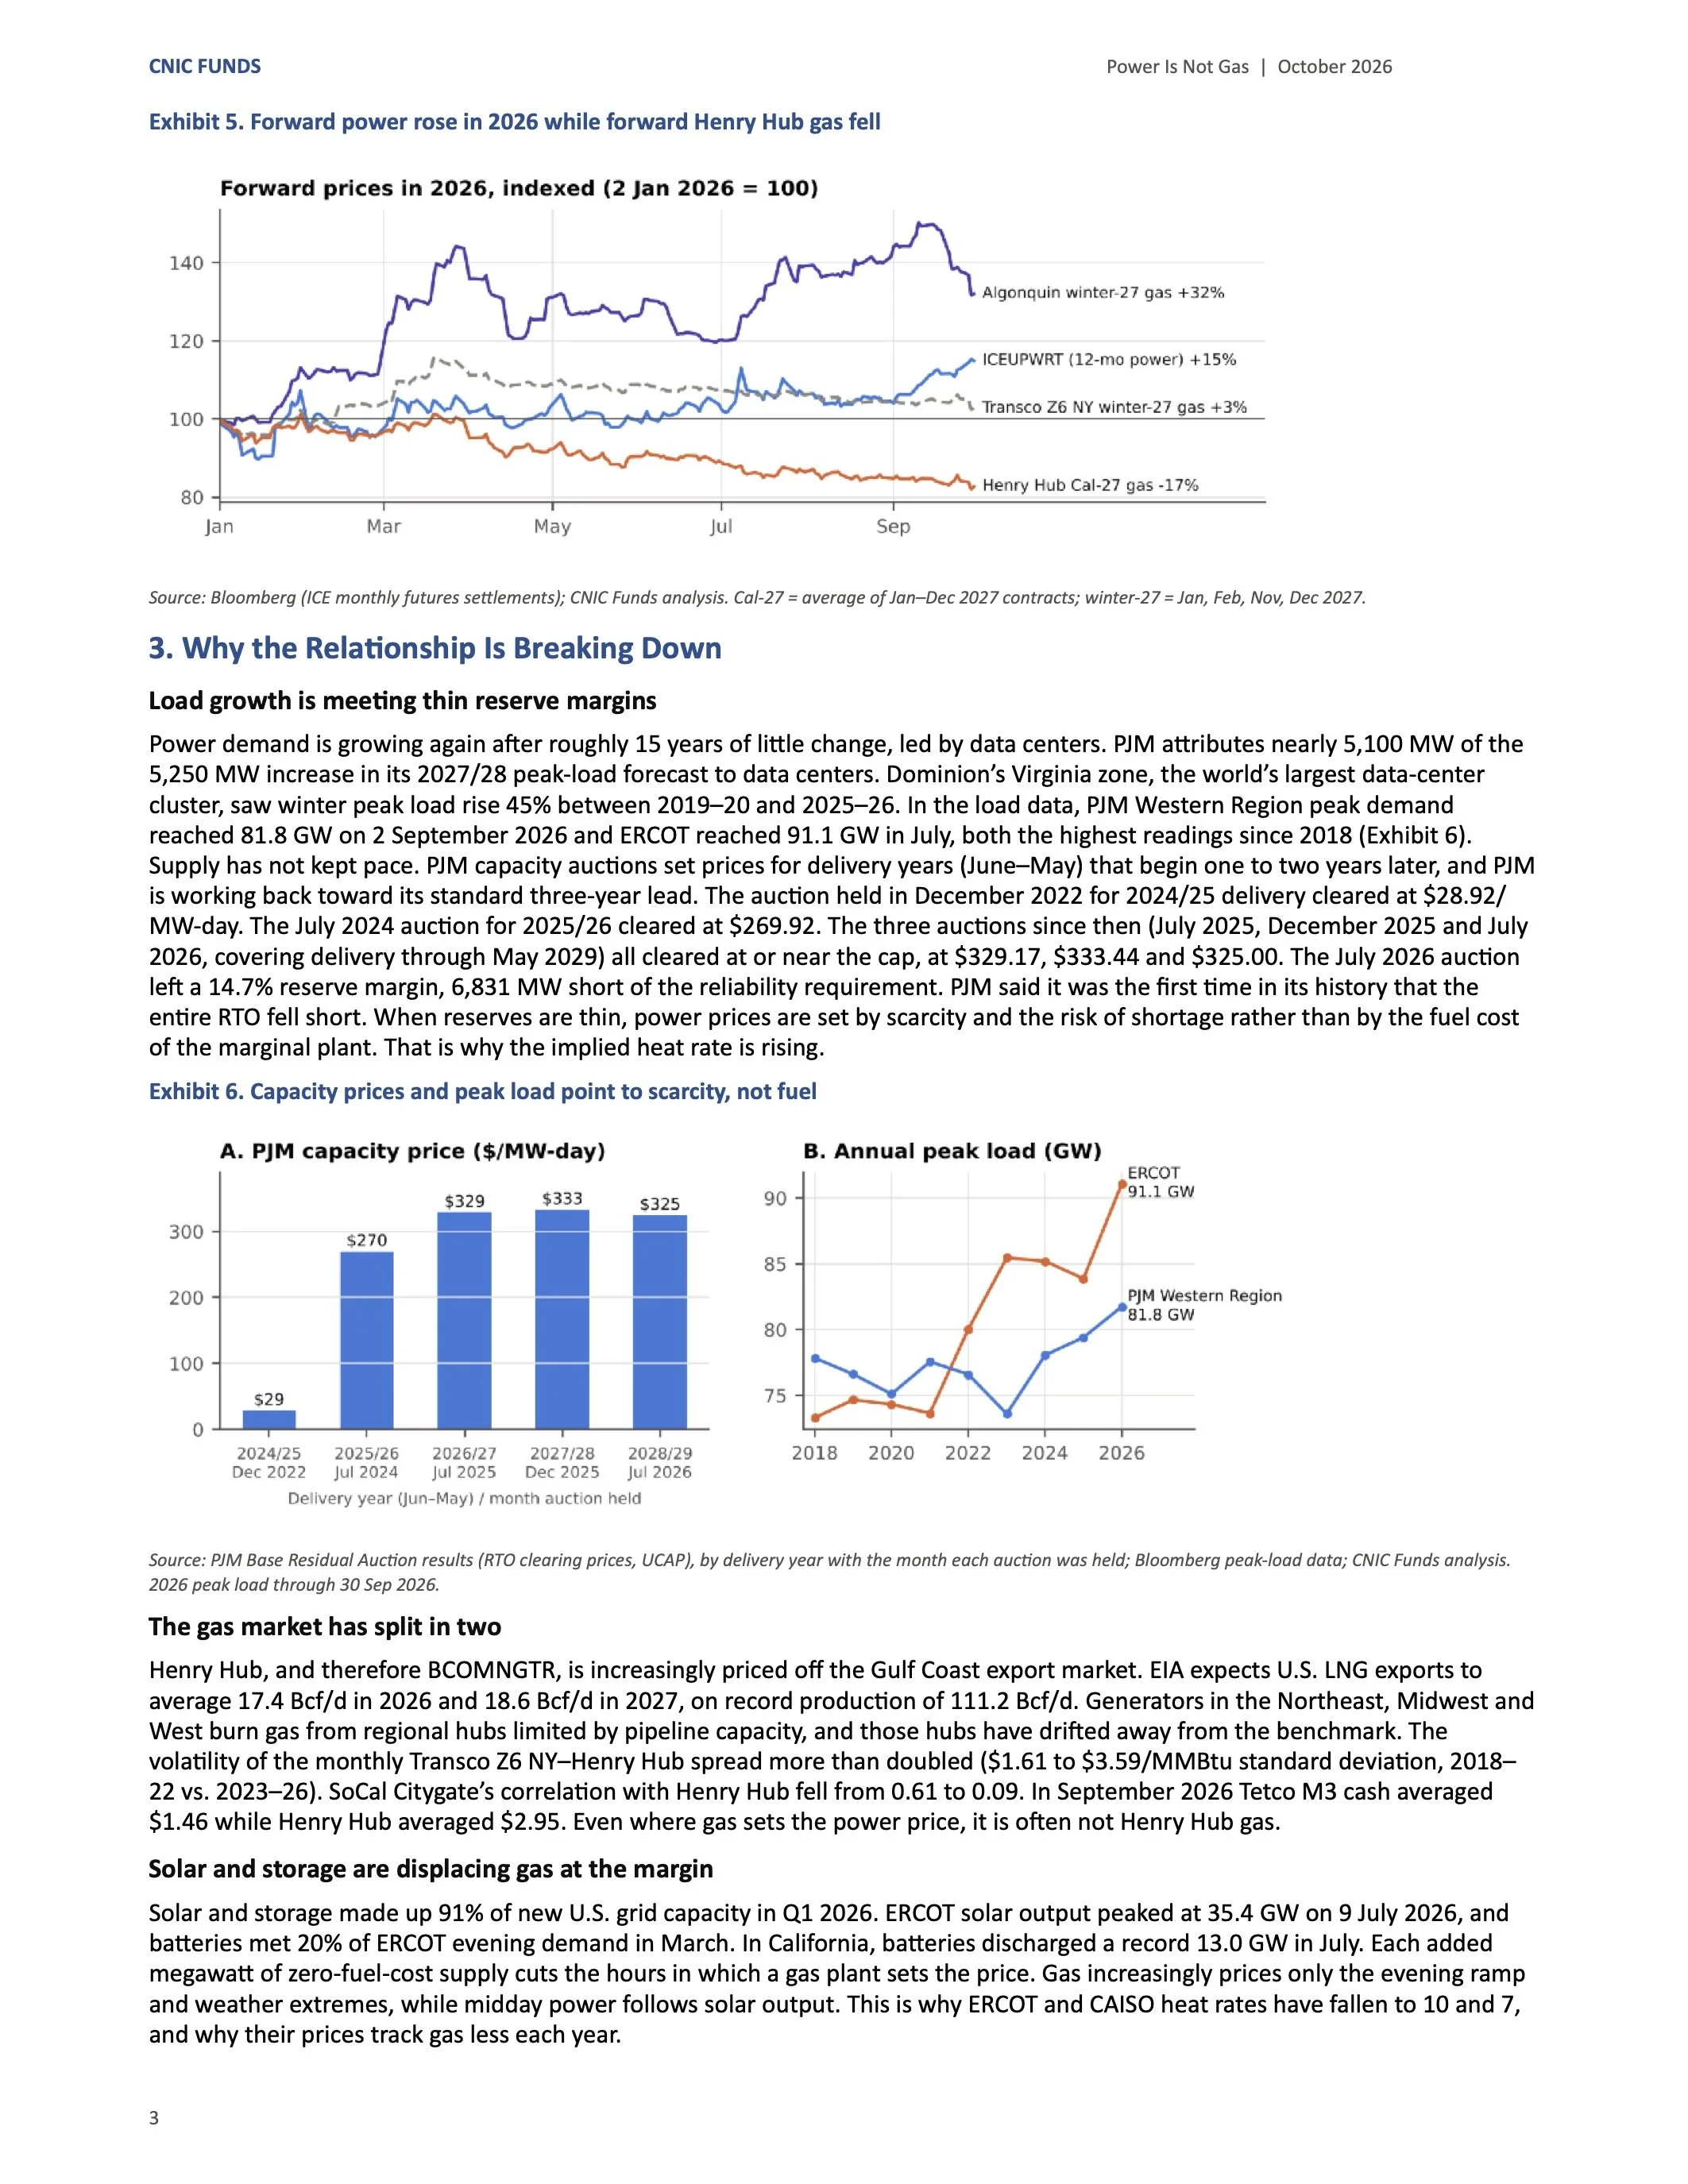
The forward curves show why. Henry Hub calendar-2027 gas fell 17% between 2 January and 30 September 2026 as record U.S. producIon weighed on the benchmark. Over the same period ICEUPWRT rose 15%, and Algonquin winter-2027 gas, which sets winter power prices in New England, rose 32% (Exhibit 5). The Algonquin–Henry Hub winter-2027 forward spread widened from $5.90 to $9.82/MMBtu. Forward power is pricing the regional factors (load, capacity and local fuel constraints) that a Henry Hub posiIon does not carry.
Exhibit 4. Power vs. natural gas futures by year
Source: Bloomberg; CNIC Funds analysis. Correla1ons of daily total returns; months = sign of monthly total return. 2026 YTD and Q3 2026 run through 30 Sep 2026.
Daily returns
2018
2019
2020
2021
2022
2023
2024
2025
2026 YTD
Q3 2026
Corr. ICEUPWRT vs BCOMNGTR
0.83
0.81
0.82
0.86
0.86
0.83
0.77
0.88
0.70
0.41
Corr. ICEPPWRT vs BCOMNGTR
0.78
0.77
0.73
0.77
0.82
0.74
0.67
0.84
0.67
0.33
R2 (12-mo power on gas)
0.69
0.65
0.67
0.74
0.74
0.69
0.60
0.78
0.49
0.17
Months moving same direcIon
8/11
9/12
12/12
10/12
12/12
10/12
9/12
9/12
3/9
0/3
2
CNIC FUNDS Power Is Not Gas | October 2026 Exhibit 5. Forward power rose in 2026 while forward Henry Hub gas fell
Source: Bloomberg (ICE monthly futures seblements); CNIC Funds analysis. Cal-27 = average of Jan–Dec 2027 contracts; winter-27 = Jan, Feb, Nov, Dec 2027.
3. Why the RelaAonship Is Breaking Down
Load growth is meeAng thin reserve margins
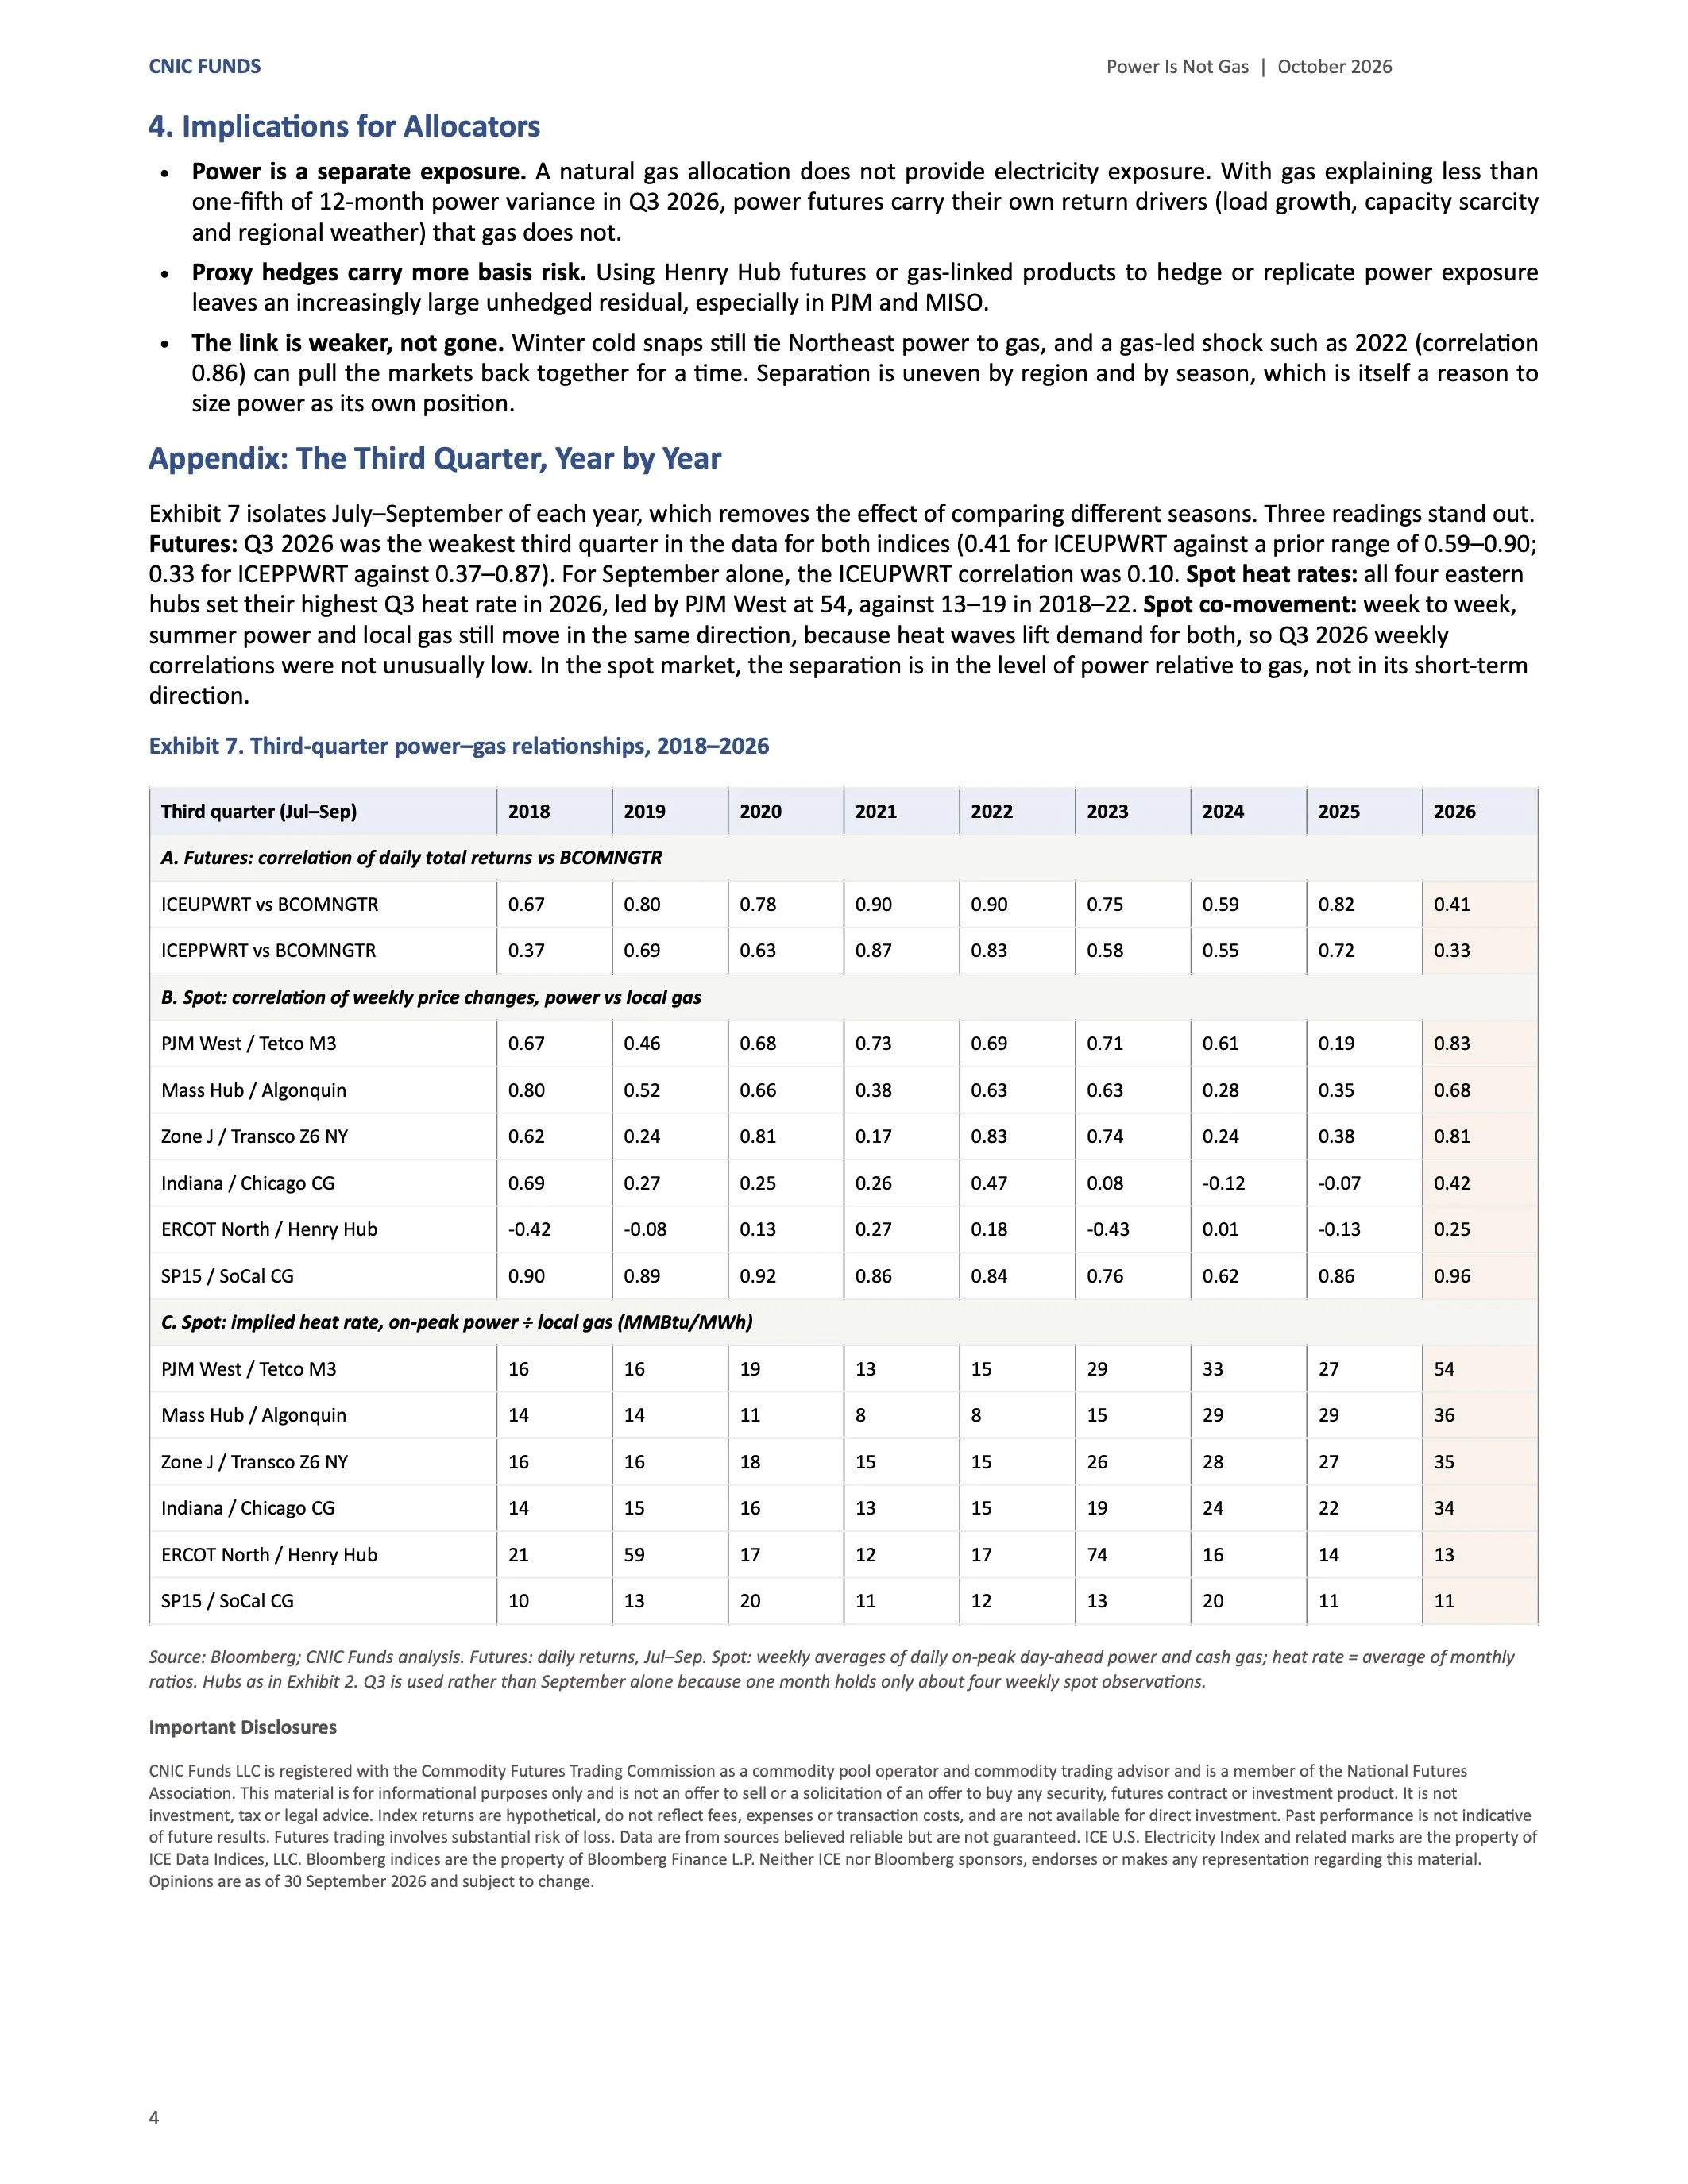
Power demand is growing again aker roughly 15 years of liqle change, led by data centers. PJM aqributes nearly 5,100 MW of the 5,250 MW increase in its 2027/28 peak-load forecast to data centers. Dominion’s Virginia zone, the world’s largest data-center cluster, saw winter peak load rise 45% between 2019–20 and 2025–26. In the load data, PJM Western Region peak demand reached 81.8 GW on 2 September 2026 and ERCOT reached 91.1 GW in July, both the highest readings since 2018 (Exhibit 6). Supply has not kept pace. PJM capacity aucIons set prices for delivery years (June–May) that begin one to two years later, and PJM is working back toward its standard three-year lead. The aucIon held in December 2022 for 2024/25 delivery cleared at $28.92/ MW-day. The July 2024 aucIon for 2025/26 cleared at $269.92. The three aucIons since then (July 2025, December 2025 and July 2026, covering delivery through May 2029) all cleared at or near the cap, at $329.17, $333.44 and $325.00. The July 2026 aucIon lek a 14.7% reserve margin, 6,831 MW short of the reliability requirement. PJM said it was the first Ime in its history that the enIre RTO fell short. When reserves are thin, power prices are set by scarcity and the risk of shortage rather than by the fuel cost of the marginal plant. That is why the implied heat rate is rising.
Exhibit 6. Capacity prices and peak load point to scarcity, not fuel
Source: PJM Base Residual Auc1on results (RTO clearing prices, UCAP), by delivery year with the month each auc1on was held; Bloomberg peak-load data; CNIC Funds analysis. 2026 peak load through 30 Sep 2026.
The gas market has split in two
Henry Hub, and therefore BCOMNGTR, is increasingly priced off the Gulf Coast export market. EIA expects U.S. LNG exports to average 17.4 Bcf/d in 2026 and 18.6 Bcf/d in 2027, on record producIon of 111.2 Bcf/d. Generators in the Northeast, Midwest and West burn gas from regional hubs limited by pipeline capacity, and those hubs have driked away from the benchmark. The volaIlity of the monthly Transco Z6 NY–Henry Hub spread more than doubled ($1.61 to $3.59/MMBtu standard deviaIon, 2018– 22 vs. 2023–26). SoCal Citygate’s correlaIon with Henry Hub fell from 0.61 to 0.09. In September 2026 Tetco M3 cash averaged $1.46 while Henry Hub averaged $2.95. Even where gas sets the power price, it is oken not Henry Hub gas.
Solar and storage are displacing gas at the margin
Solar and storage made up 91% of new U.S. grid capacity in Q1 2026. ERCOT solar output peaked at 35.4 GW on 9 July 2026, and baqeries met 20% of ERCOT evening demand in March. In California, baqeries discharged a record 13.0 GW in July. Each added megawaq of zero-fuel-cost supply cuts the hours in which a gas plant sets the price. Gas increasingly prices only the evening ramp and weather extremes, while midday power follows solar output. This is why ERCOT and CAISO heat rates have fallen to 10 and 7, and why their prices track gas less each year.
3
CNIC FUNDS Power Is Not Gas | October 2026 4. ImplicaAons for Allocators
Power is a separate exposure. A natural gas allocaIon does not provide electricity exposure. With gas explaining less than one-fikh of 12-month power variance in Q3 2026, power futures carry their own return drivers (load growth, capacity scarcity and regional weather) that gas does not.
Proxy hedges carry more basis risk. Using Henry Hub futures or gas-linked products to hedge or replicate power exposure leaves an increasingly large unhedged residual, especially in PJM and MISO.
The link is weaker, not gone. Winter cold snaps sIll Ie Northeast power to gas, and a gas-led shock such as 2022 (correlaIon 0.86) can pull the markets back together for a Ime. SeparaIon is uneven by region and by season, which is itself a reason to size power as its own posiIon.
Appendix: The Third Quarter, Year by Year
Exhibit 7 isolates July–September of each year, which removes the effect of comparing different seasons. Three readings stand out. Futures: Q3 2026 was the weakest third quarter in the data for both indices (0.41 for ICEUPWRT against a prior range of 0.59–0.90; 0.33 for ICEPPWRT against 0.37–0.87). For September alone, the ICEUPWRT correlaIon was 0.10. Spot heat rates: all four eastern hubs set their highest Q3 heat rate in 2026, led by PJM West at 54, against 13–19 in 2018–22. Spot co-movement: week to week, summer power and local gas sIll move in the same direcIon, because heat waves lik demand for both, so Q3 2026 weekly correlaIons were not unusually low. In the spot market, the separaIon is in the level of power relaIve to gas, not in its short-term direcIon.
Exhibit 7. Third-quarter power–gas relaAonships, 2018–2026
Third quarter (Jul–Sep) 2018 2019 2020 2021 2022 2023 2024 2025 2026
A. Futures: correla/on of daily total returns vs BCOMNGTR
ICEUPWRT vs BCOMNGTR
0.67
0.80
0.78
0.90
0.90
0.75
0.59
0.82
0.41
ICEPPWRT vs BCOMNGTR
0.37
0.69
0.63
0.87
0.83
0.58
0.55
0.72
0.33
B. Spot: correla/on of weekly price changes, power vs local gas
PJM West / Tetco M3
0.67
0.46
0.68
0.73
0.69
0.71
0.61
0.19
0.83
Mass Hub / Algonquin
0.80
0.52
0.66
0.38
0.63
0.63
0.28
0.35
0.68
Zone J / Transco Z6 NY
0.62
0.24
0.81
0.17
0.83
0.74
0.24
0.38
0.81
Indiana / Chicago CG
0.69
0.27
0.25
0.26
0.47
0.08
-0.12
-0.07
0.42
ERCOT North / Henry Hub
-0.42
-0.08
0.13
0.27
0.18
-0.43
0.01
-0.13
0.25
SP15 / SoCal CG
0.90
0.89
0.92
0.86
0.84
0.76
0.62
0.86
0.96
C. Spot: implied heat rate, on-peak power ÷ local gas (MMBtu/MWh)
PJM West / Tetco M3
16
16
19
13
15
29
33
27
54
Mass Hub / Algonquin
14
14
11
8
8
15
29
29
36
Zone J / Transco Z6 NY
16
16
18
15
15
26
28
27
35
Indiana / Chicago CG
14
15
16
13
15
19
24
22
34
ERCOT North / Henry Hub
21
59
17
12
17
74
16
14
13
SP15 / SoCal CG
10
13
20
11
12
13
20
11
11
Source: Bloomberg; CNIC Funds analysis. Futures: daily returns, Jul–Sep. Spot: weekly averages of daily on-peak day-ahead power and cash gas; heat rate = average of monthly ra1os. Hubs as in Exhibit 2. Q3 is used rather than September alone because one month holds only about four weekly spot observa1ons.
Important Disclosures
CNIC Funds LLC is registered with the Commodity Futures Trading Commission as a commodity pool operator and commodity trading advisor and is a member of the NaIonal Futures AssociaIon. This material is for informaIonal purposes only and is not an offer to sell or a solicitaIon of an offer to buy any security, futures contract or investment product. It is not investment, tax or legal advice. Index returns are hypotheIcal, do not reflect fees, expenses or transacIon costs, and are not available for direct investment. Past performance is not indicaIve of future results. Futures trading involves substanIal risk of loss. Data are from sources believed reliable but are not guaranteed. ICE U.S. Electricity Index and related marks are the property of ICE Data Indices, LLC. Bloomberg indices are the property of Bloomberg Finance L.P. Neither ICE nor Bloomberg sponsors, endorses or makes any representaIon regarding this material. Opinions are as of 30 September 2026 and subject to change.
4
