
Electricity: The Undiscovered AI Trade
CNIC FUNDS LLC | October 2026 | Data as of 30 September 2026
Electricity: The Undiscovered AI Trade
Why a 12-month strip of U.S. electricity futures is the most direct, least crowded and least recognized way to invest in AI and data center growth, and why it now sits at the same inflection point that sent the earlier AI trades higher
Executive Summary
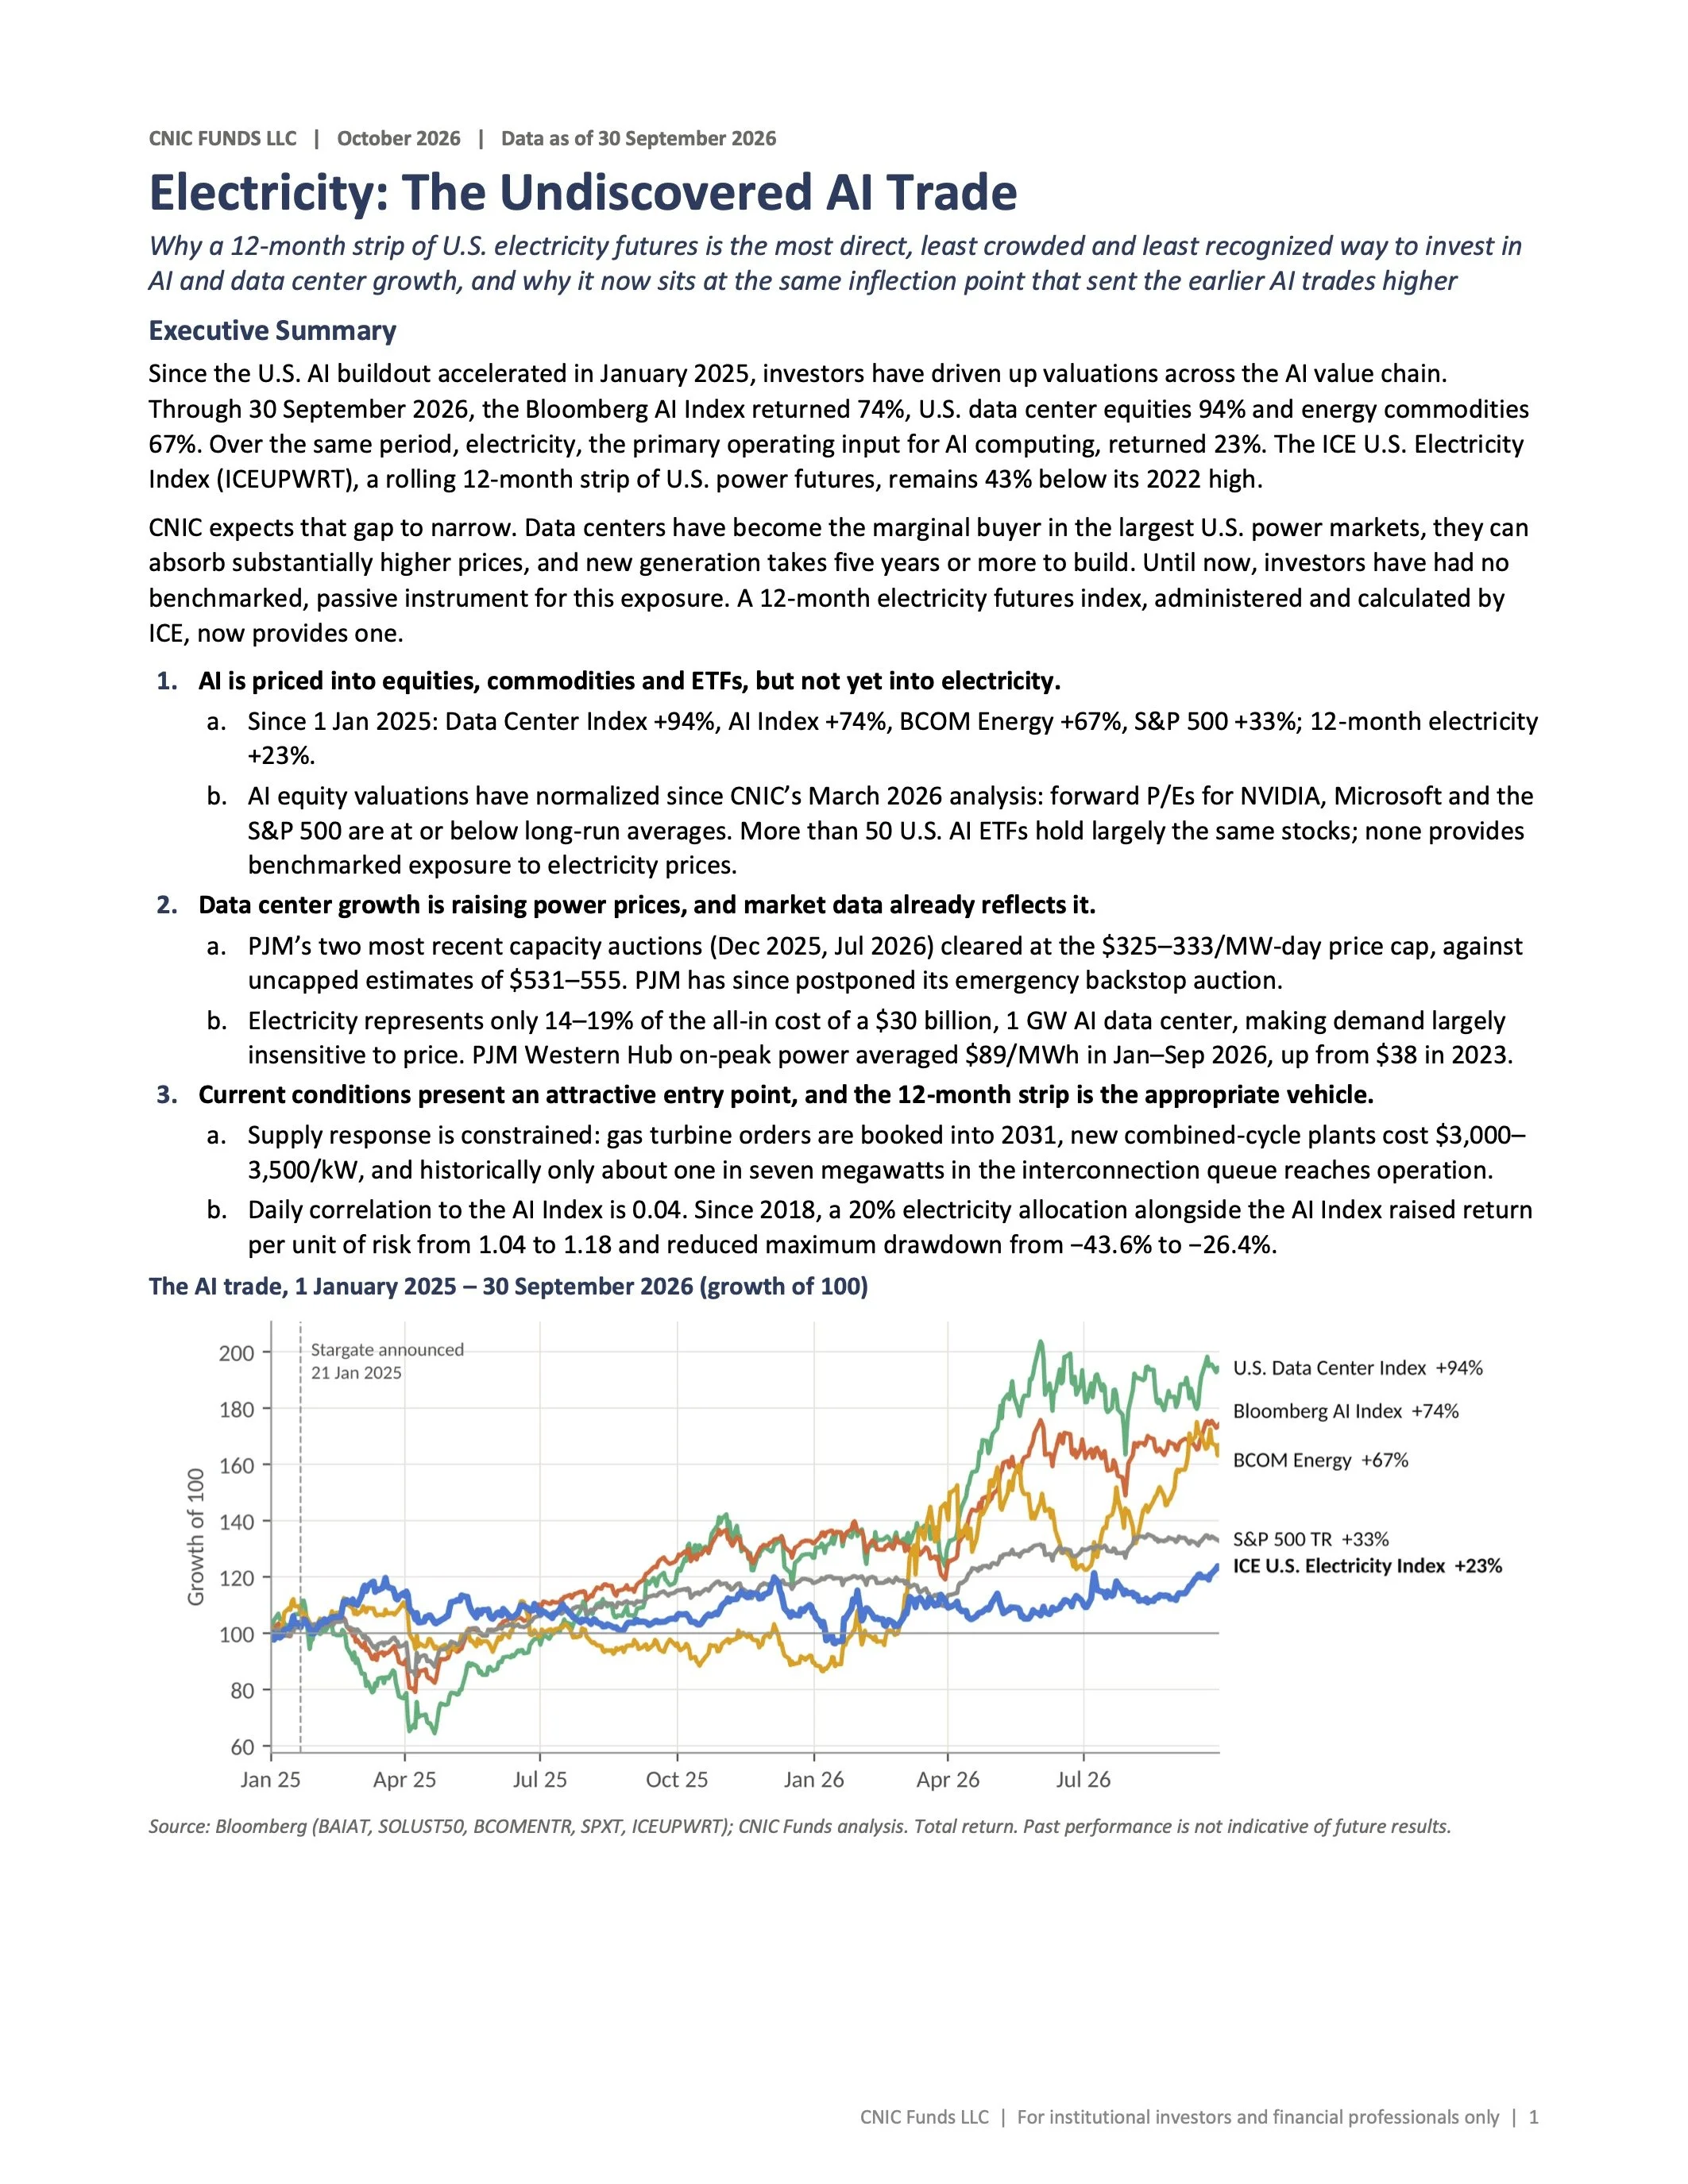
Since the U.S. AI buildout accelerated in January 2025, investors have driven up valuations across the AI value chain. Through 30 September 2026, the Bloomberg AI Index returned 74%, U.S. data center equities 94% and energy commodities 67%. Over the same period, electricity, the primary operating input for AI computing, returned 23%. The ICE U.S. Electricity Index (ICEUPWRT), a rolling 12-month strip of U.S. power futures, remains 43% below its 2022 high.
CNIC expects that gap to narrow. Data centers have become the marginal buyer in the largest U.S. power markets, they can absorb substantially higher prices, and new generation takes five years or more to build. Until now, investors have had no benchmarked, passive instrument for this exposure. A 12-month electricity futures index, administered and calculated by ICE, now provides one.
AI is priced into equities, commodities and ETFs, but not yet into electricity.
Since 1 Jan 2025: Data Center Index +94%, AI Index +74%, BCOM Energy +67%, S&P 500 +33%; 12-month electricity
+23%.
AI equity valuations have normalized since CNIC’s March 2026 analysis: forward P/Es for NVIDIA, Microsoft and the S&P 500 are at or below long-run averages. More than 50 U.S. AI ETFs hold largely the same stocks; none provides benchmarked exposure to electricity prices.
Data center growth is raising power prices, and market data already reflects it.
PJM’s two most recent capacity auctions (Dec 2025, Jul 2026) cleared at the $325–333/MW-day price cap, against
uncapped estimates of $531–555. PJM has since postponed its emergency backstop auction.
Electricity represents only 14–19% of the all-in cost of a $30 billion, 1 GW AI data center, making demand largely insensitive to price. PJM Western Hub on-peak power averaged $89/MWh in Jan–Sep 2026, up from $38 in 2023.
Current conditions present an attractive entry point, and the 12-month strip is the appropriate vehicle.
Supply response is constrained: gas turbine orders are booked into 2031, new combined-cycle plants cost $3,000–
3,500/kW, and historically only about one in seven megawatts in the interconnection queue reaches operation.
Daily correlation to the AI Index is 0.04. Since 2018, a 20% electricity allocation alongside the AI Index raised return per unit of risk from 1.04 to 1.18 and reduced maximum drawdown from −43.6% to −26.4%.
The AI trade, 1 January 2025 – 30 September 2026 (growth of 100)
Source: Bloomberg (BAIAT, SOLUST50, BCOMENTR, SPXT, ICEUPWRT); CNIC Funds analysis. Total return. Past performance is not indicative of future results.
CNIC Funds LLC | For institutional investors and financial professionals only | 1
1. AI is priced into equities and commodities, but not electricity
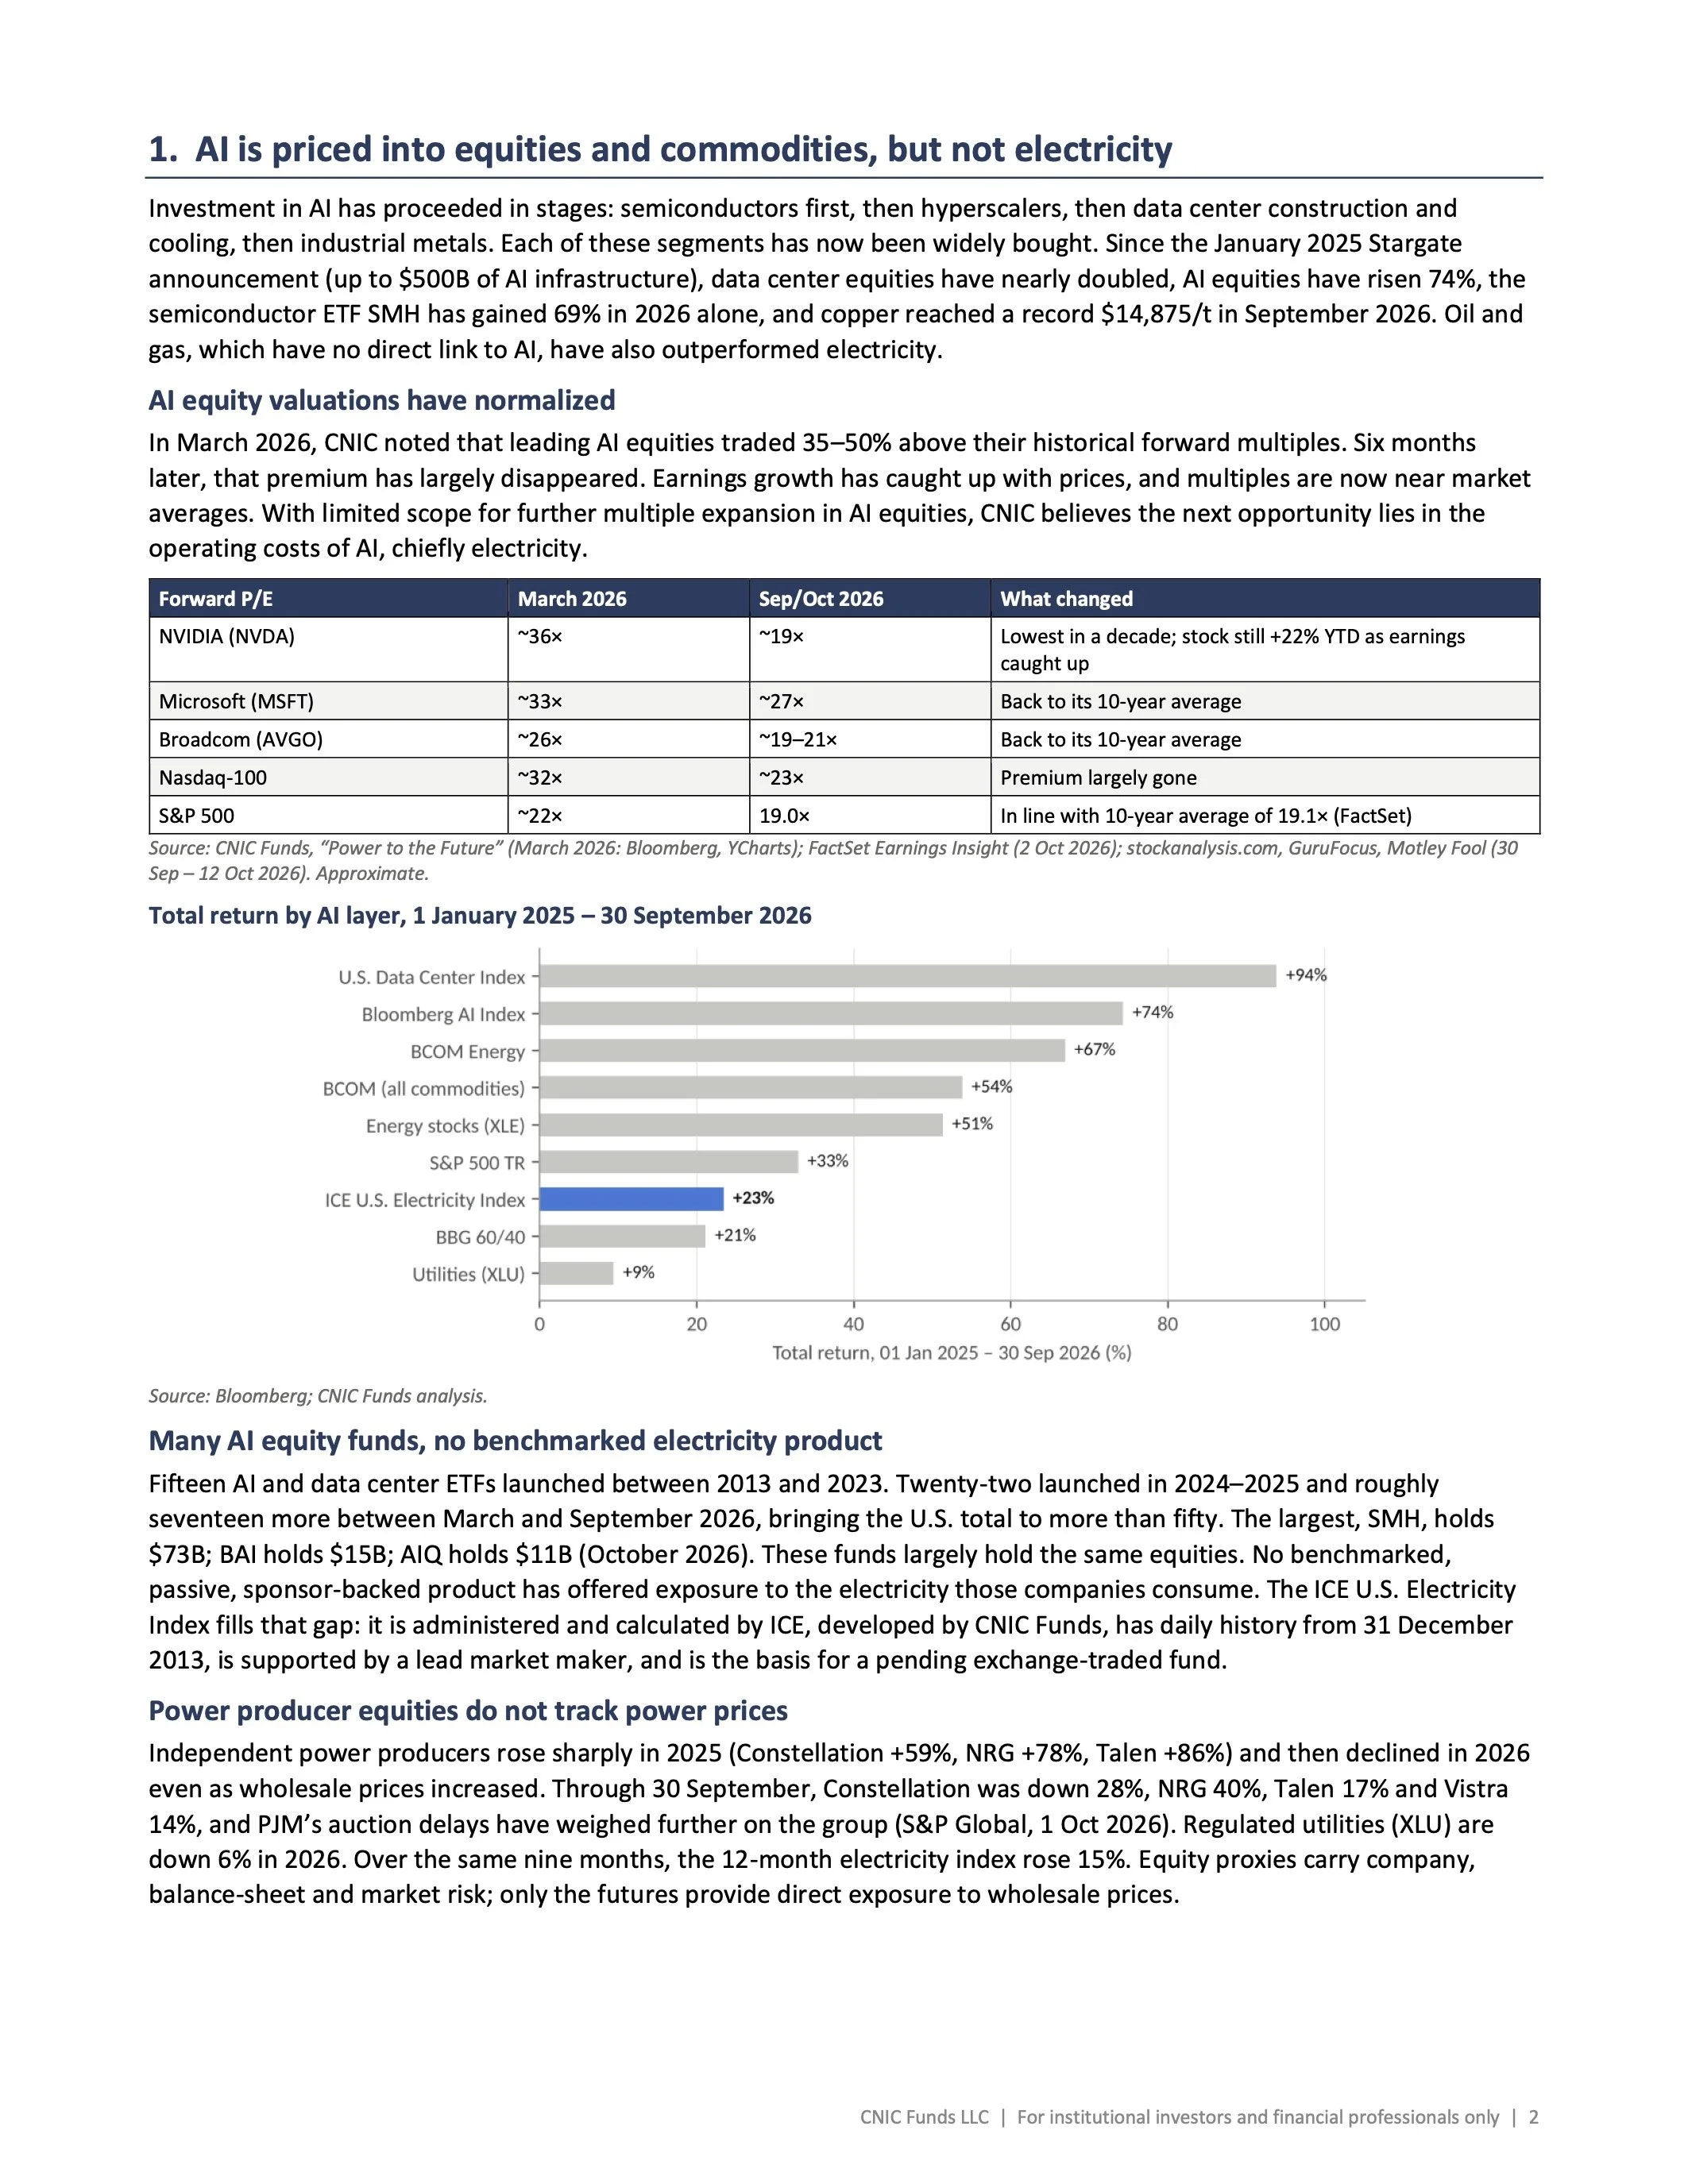
Investment in AI has proceeded in stages: semiconductors first, then hyperscalers, then data center construction and cooling, then industrial metals. Each of these segments has now been widely bought. Since the January 2025 Stargate announcement (up to $500B of AI infrastructure), data center equities have nearly doubled, AI equities have risen 74%, the semiconductor ETF SMH has gained 69% in 2026 alone, and copper reached a record $14,875/t in September 2026. Oil and gas, which have no direct link to AI, have also outperformed electricity.
AI equity valuations have normalized
In March 2026, CNIC noted that leading AI equities traded 35–50% above their historical forward multiples. Six months later, that premium has largely disappeared. Earnings growth has caught up with prices, and multiples are now near market averages. With limited scope for further multiple expansion in AI equities, CNIC believes the next opportunity lies in the operating costs of AI, chiefly electricity.
Forward P/E
March 2026
Sep/Oct 2026
What changed
NVIDIA (NVDA)
Broadcom (AVGO) S&P 500
~36× ~19×
~26× ~19–21× ~22× 19.0×
Lowest in a decade; stock still +22% YTD as earnings caught up
Back to its 10-year average
In line with 10-year average of 19.1× (FactSet)
Microsoft (MSFT)
~33×
~27×
Back to its 10-year average
Nasdaq-100
~32×
~23×
Premium largely gone
Source: CNIC Funds, “Power to the Future” (March 2026: Bloomberg, YCharts); FactSet Earnings Insight (2 Oct 2026); stockanalysis.com, GuruFocus, Motley Fool (30 Sep – 12 Oct 2026). Approximate.
Total return by AI layer, 1 January 2025 – 30 September 2026
Source: Bloomberg; CNIC Funds analysis.
Many AI equity funds, no benchmarked electricity product
Fifteen AI and data center ETFs launched between 2013 and 2023. Twenty-two launched in 2024–2025 and roughly seventeen more between March and September 2026, bringing the U.S. total to more than fifty. The largest, SMH, holds $73B; BAI holds $15B; AIQ holds $11B (October 2026). These funds largely hold the same equities. No benchmarked, passive, sponsor-backed product has offered exposure to the electricity those companies consume. The ICE U.S. Electricity Index fills that gap: it is administered and calculated by ICE, developed by CNIC Funds, has daily history from 31 December 2013, is supported by a lead market maker, and is the basis for a pending exchange-traded fund.
Power producer equities do not track power prices
Independent power producers rose sharply in 2025 (Constellation +59%, NRG +78%, Talen +86%) and then declined in 2026 even as wholesale prices increased. Through 30 September, Constellation was down 28%, NRG 40%, Talen 17% and Vistra 14%, and PJM’s auction delays have weighed further on the group (S&P Global, 1 Oct 2026). Regulated utilities (XLU) are down 6% in 2026. Over the same nine months, the 12-month electricity index rose 15%. Equity proxies carry company, balance-sheet and market risk; only the futures provide direct exposure to wholesale prices.
CNIC Funds LLC | For institutional investors and financial professionals only | 2
2. Data center growth is raising power prices
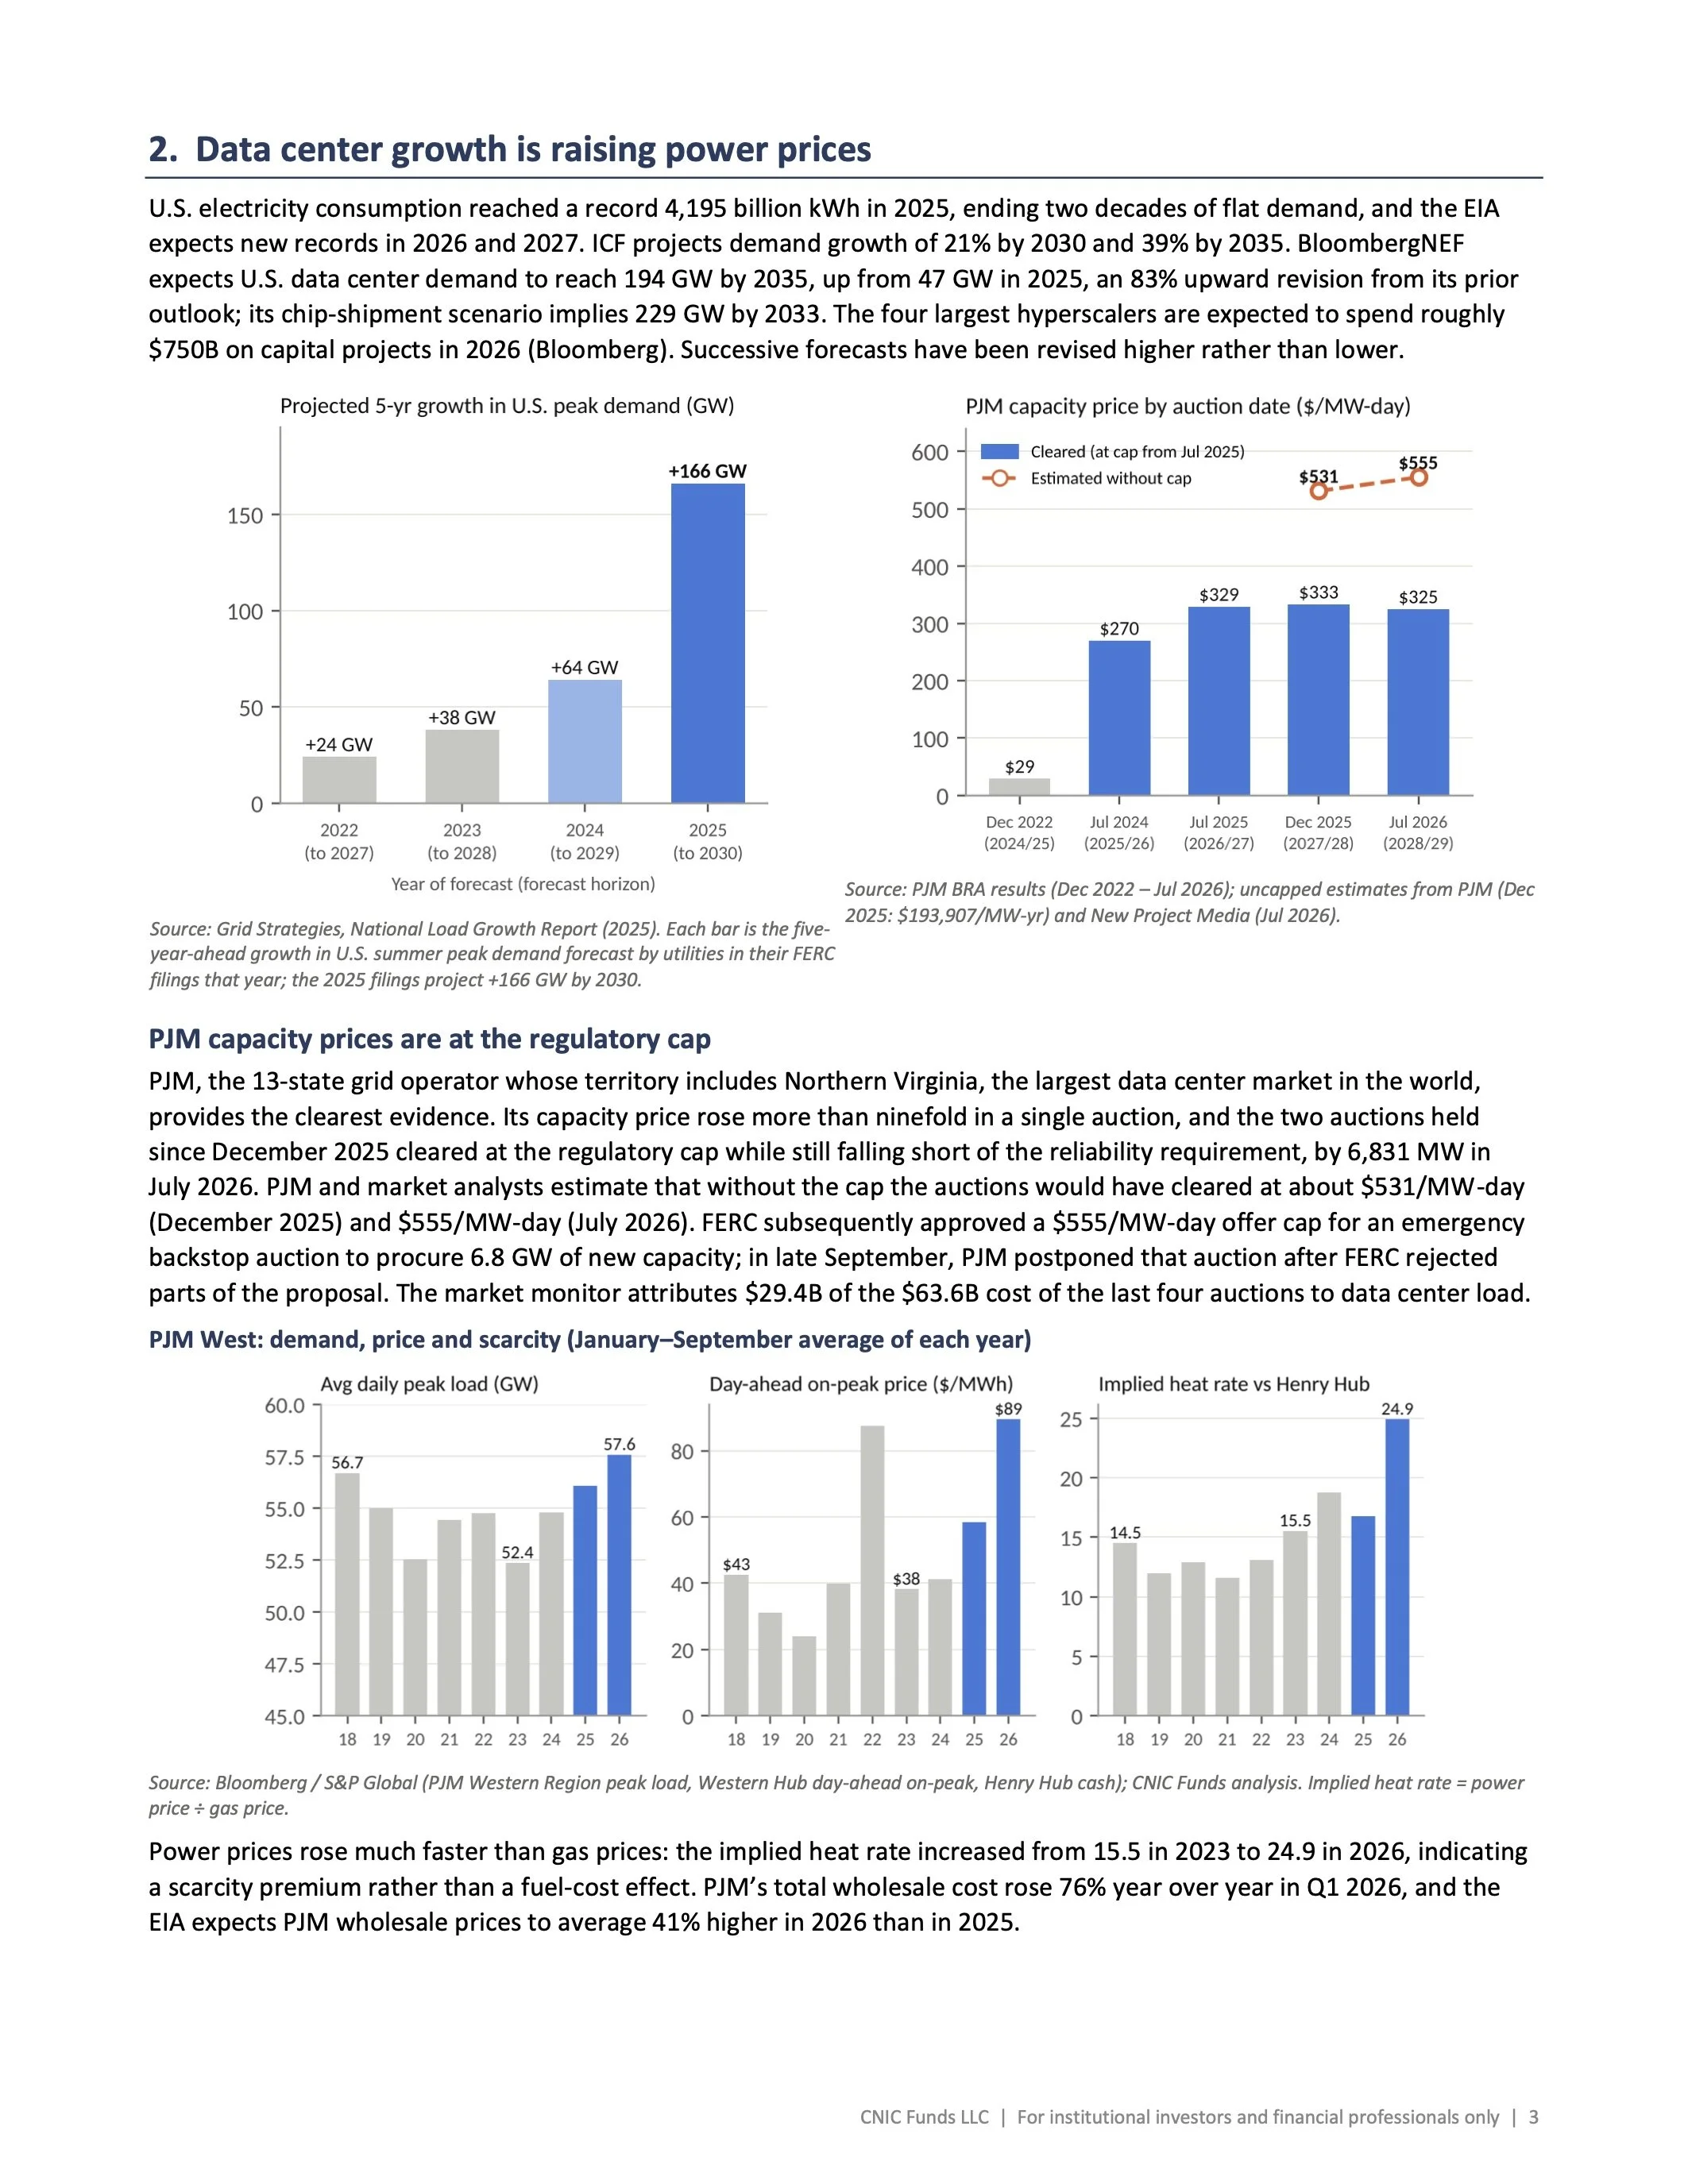
U.S. electricity consumption reached a record 4,195 billion kWh in 2025, ending two decades of flat demand, and the EIA expects new records in 2026 and 2027. ICF projects demand growth of 21% by 2030 and 39% by 2035. BloombergNEF expects U.S. data center demand to reach 194 GW by 2035, up from 47 GW in 2025, an 83% upward revision from its prior outlook; its chip-shipment scenario implies 229 GW by 2033. The four largest hyperscalers are expected to spend roughly $750B on capital projects in 2026 (Bloomberg). Successive forecasts have been revised higher rather than lower.
Source: PJM BRA results (Dec 2022 – Jul 2026); uncapped estimates from PJM (Dec
Source: Grid Strategies, National Load Growth Report (2025). Each bar is the five- 2025: $193,907/MW-yr) and New Project Media (Jul 2026). year-ahead growth in U.S. summer peak demand forecast by utilities in their FERC
filings that year; the 2025 filings project +166 GW by 2030.
PJM capacity prices are at the regulatory cap
PJM, the 13-state grid operator whose territory includes Northern Virginia, the largest data center market in the world, provides the clearest evidence. Its capacity price rose more than ninefold in a single auction, and the two auctions held since December 2025 cleared at the regulatory cap while still falling short of the reliability requirement, by 6,831 MW in July 2026. PJM and market analysts estimate that without the cap the auctions would have cleared at about $531/MW-day (December 2025) and $555/MW-day (July 2026). FERC subsequently approved a $555/MW-day offer cap for an emergency backstop auction to procure 6.8 GW of new capacity; in late September, PJM postponed that auction after FERC rejected parts of the proposal. The market monitor attributes $29.4B of the $63.6B cost of the last four auctions to data center load.
PJM West: demand, price and scarcity (January–September average of each year)
Source: Bloomberg / S&P Global (PJM Western Region peak load, Western Hub day-ahead on-peak, Henry Hub cash); CNIC Funds analysis. Implied heat rate = power price ÷ gas price.
Power prices rose much faster than gas prices: the implied heat rate increased from 15.5 in 2023 to 24.9 in 2026, indicating a scarcity premium rather than a fuel-cost effect. PJM’s total wholesale cost rose 76% year over year in Q1 2026, and the EIA expects PJM wholesale prices to average 41% higher in 2026 than in 2025.
CNIC Funds LLC | For institutional investors and financial professionals only | 3
3. Price-insensitive demand, constrained supply, other ISOs to follow
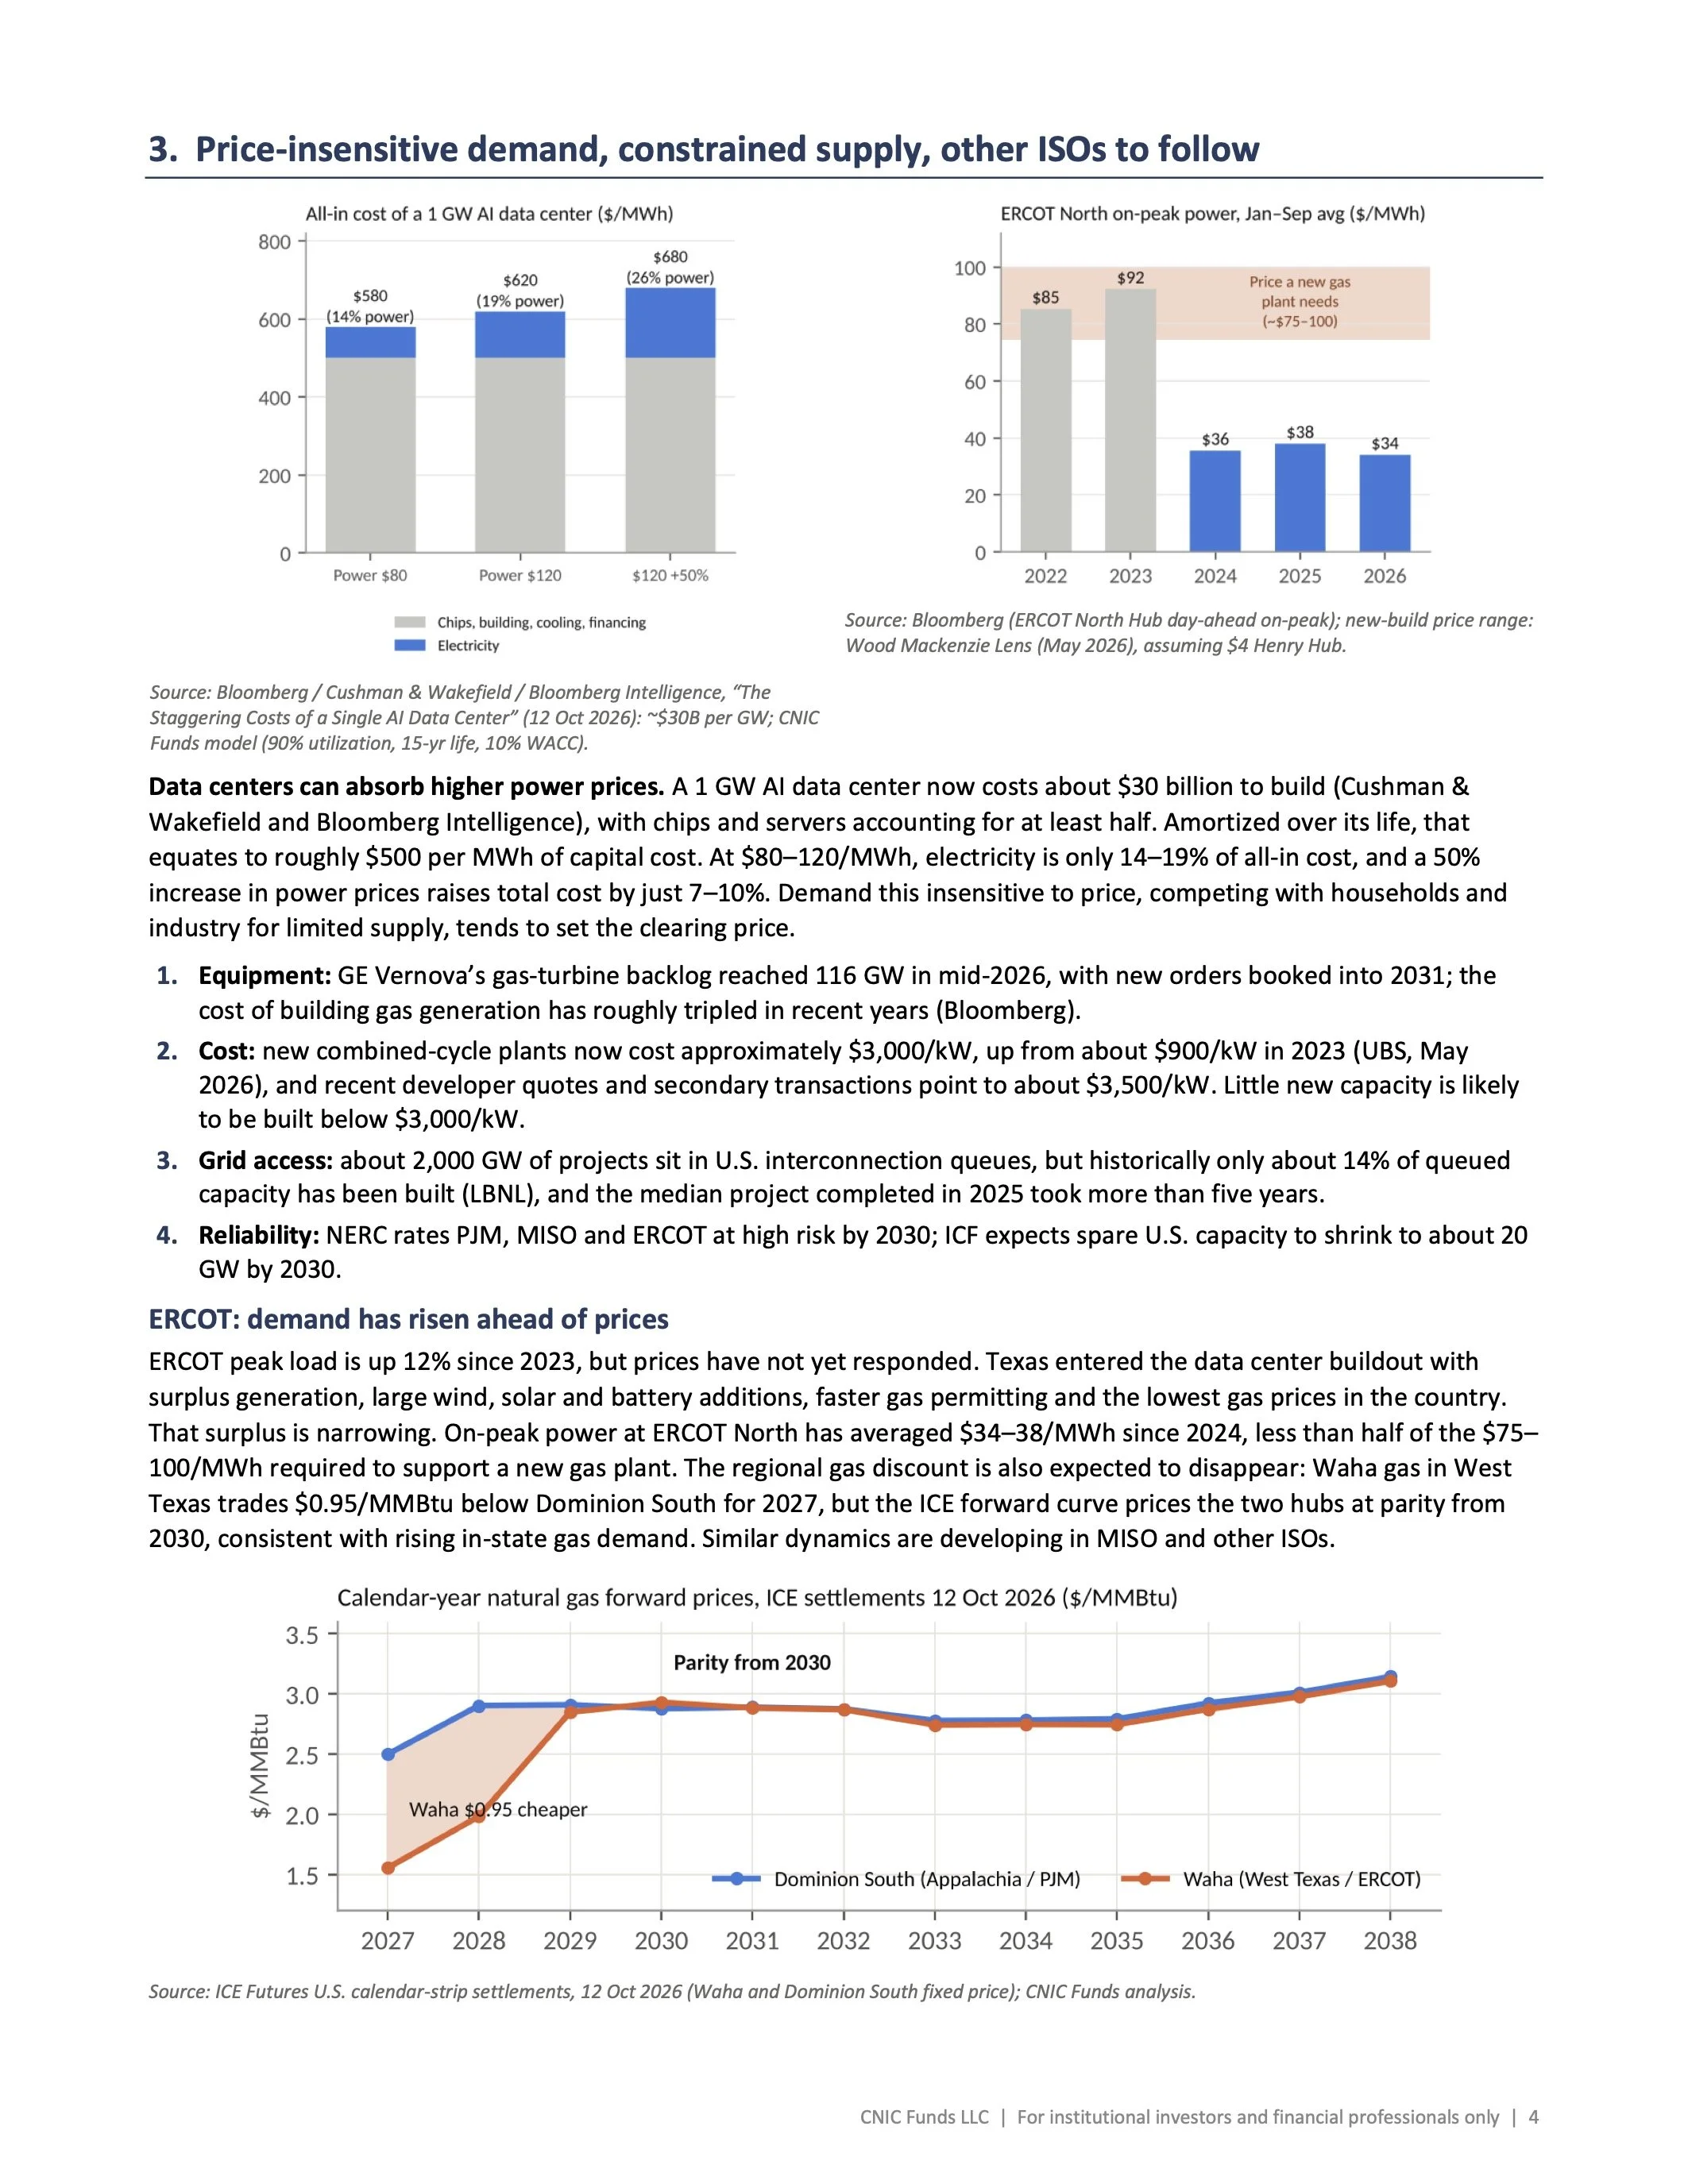
Source: Bloomberg / Cushman & Wakefield / Bloomberg Intelligence, “The Staggering Costs of a Single AI Data Center” (12 Oct 2026): ~$30B per GW; CNIC Funds model (90% utilization, 15-yr life, 10% WACC).
Data centers can absorb higher power prices. A 1 GW AI data center now costs about $30 billion to build (Cushman & Wakefield and Bloomberg Intelligence), with chips and servers accounting for at least half. Amortized over its life, that equates to roughly $500 per MWh of capital cost. At $80–120/MWh, electricity is only 14–19% of all-in cost, and a 50% increase in power prices raises total cost by just 7–10%. Demand this insensitive to price, competing with households and industry for limited supply, tends to set the clearing price.
Equipment: GE Vernova’s gas-turbine backlog reached 116 GW in mid-2026, with new orders booked into 2031; the cost of building gas generation has roughly tripled in recent years (Bloomberg).
Cost: new combined-cycle plants now cost approximately $3,000/kW, up from about $900/kW in 2023 (UBS, May 2026), and recent developer quotes and secondary transactions point to about $3,500/kW. Little new capacity is likely to be built below $3,000/kW.
Grid access: about 2,000 GW of projects sit in U.S. interconnection queues, but historically only about 14% of queued capacity has been built (LBNL), and the median project completed in 2025 took more than five years.
Reliability: NERC rates PJM, MISO and ERCOT at high risk by 2030; ICF expects spare U.S. capacity to shrink to about 20 GW by 2030.
ERCOT: demand has risen ahead of prices
ERCOT peak load is up 12% since 2023, but prices have not yet responded. Texas entered the data center buildout with surplus generation, large wind, solar and battery additions, faster gas permitting and the lowest gas prices in the country. That surplus is narrowing. On-peak power at ERCOT North has averaged $34–38/MWh since 2024, less than half of the $75– 100/MWh required to support a new gas plant. The regional gas discount is also expected to disappear: Waha gas in West Texas trades $0.95/MMBtu below Dominion South for 2027, but the ICE forward curve prices the two hubs at parity from 2030, consistent with rising in-state gas demand. Similar dynamics are developing in MISO and other ISOs.
Source: ICE Futures U.S. calendar-strip settlements, 12 Oct 2026 (Waha and Dominion South fixed price); CNIC Funds analysis.
Source: Bloomberg (ERCOT North Hub day-ahead on-peak); new-build price range: Wood Mackenzie Lens (May 2026), assuming $4 Henry Hub.
CNIC Funds LLC | For institutional investors and financial professionals only | 4
4. The forward curve has yet to reflect scarcity; the 12-month strip captures it ICE U.S. Electricity Index (ICEUPWRT), 31 December 2017 – 30 September 2026
Source: Bloomberg (ICEUPWRT Index). Past performance is not indicative of future results.
The index returned +71.5% in 2021 and +97.4% in 2022, when Winter Storm Uri and the Ukraine-related gas spike lifted Henry Hub to an average of $6.67/MMBtu (Jan–Sep 2022). That period illustrates the index’s response to tight power markets. Current conditions differ: gas averaged $3.59 in Jan–Sep 2026, about half the 2022 level, yet PJM Western Hub on- peak power averaged $89/MWh, above the $88 recorded in the same months of 2022. Today’s tightness is driven by demand rather than fuel costs, yet the index remains 43% below its May 2022 peak. Spot power in the largest U.S. data center market already exceeds 2022 levels; the investable forward strip does not.
Why the 12-month strip
The index holds a 12-month strip of ICE peak electricity futures across six hubs, weighted by each grid’s load: PJM (33%), MISO (28%), ERCOT (18%), CAISO (9%), NYISO (6%) and ISO New England (5%). PJM and MISO, the two regions NERC rates as high-risk and where data center load is growing fastest, account for 61% of the index. A 12-month strip reflects repricing of the forward curve as scarcity becomes structural, averages across seasons and limits the roll costs of holding only the prompt month. Unlike power producer or utility equities, it carries no equity beta (correlation of 0.04 to the AI Index).
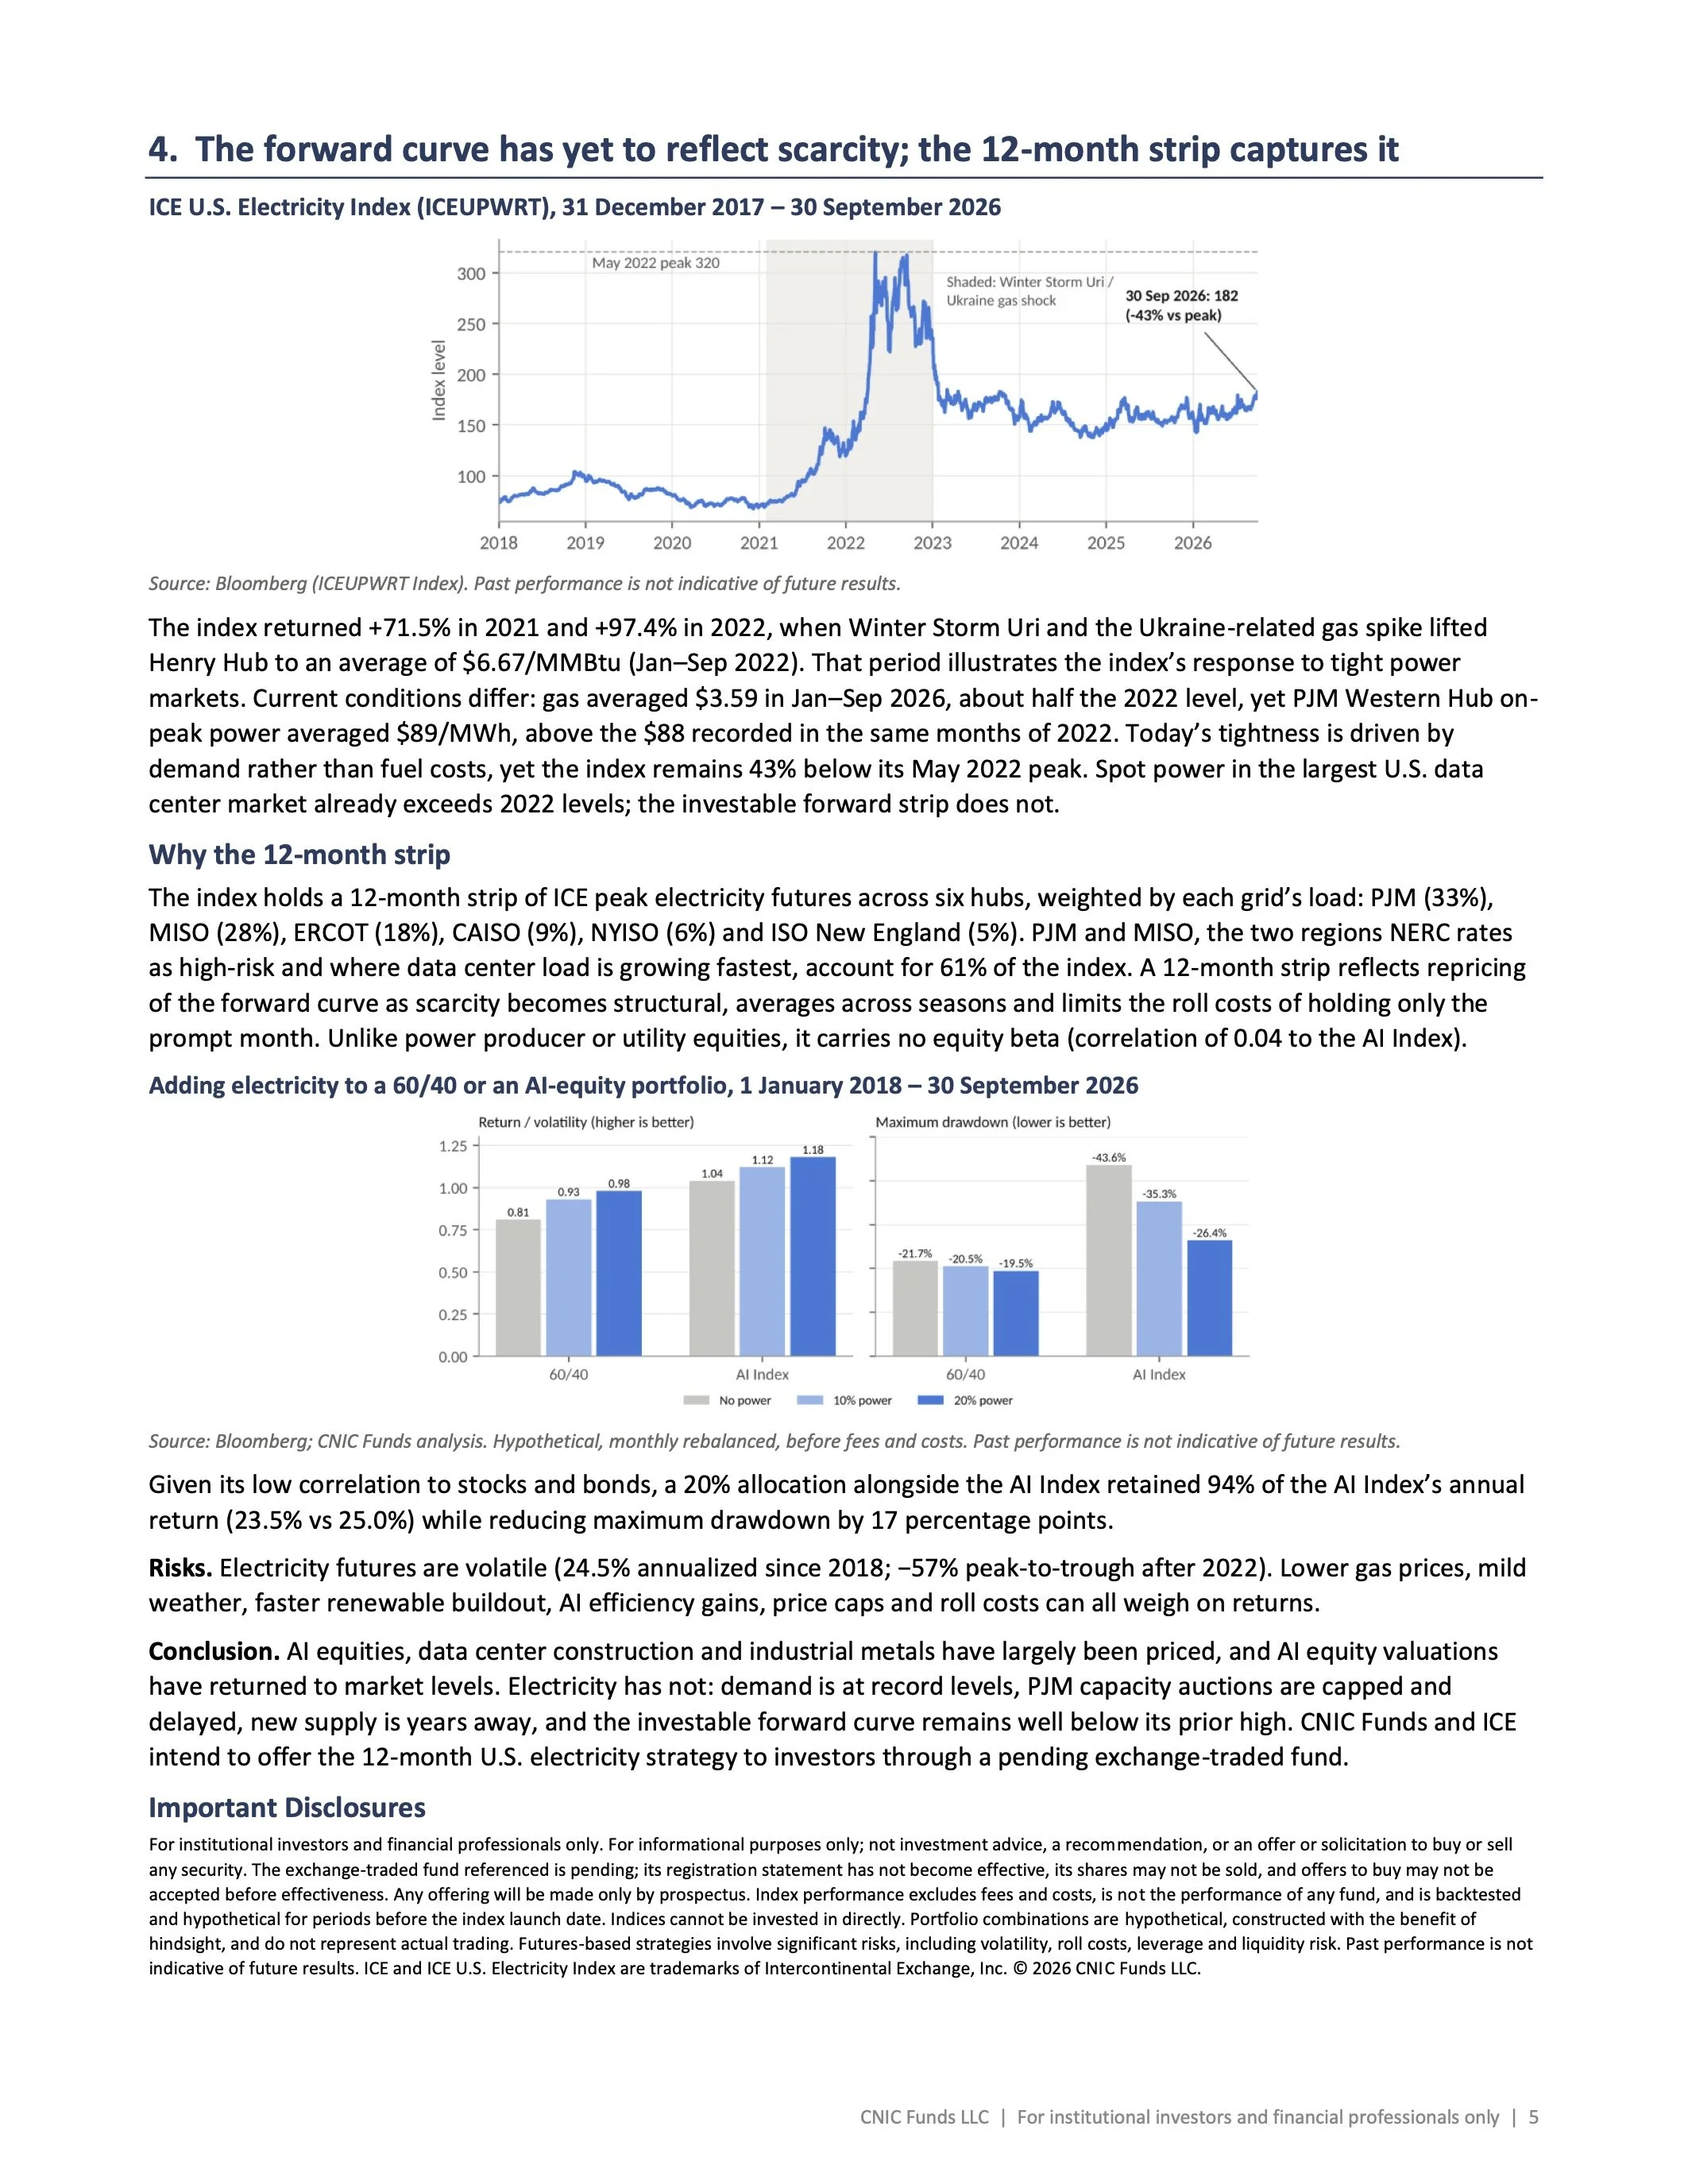
Adding electricity to a 60/40 or an AI-equity portfolio, 1 January 2018 – 30 September 2026
Source: Bloomberg; CNIC Funds analysis. Hypothetical, monthly rebalanced, before fees and costs. Past performance is not indicative of future results.
Given its low correlation to stocks and bonds, a 20% allocation alongside the AI Index retained 94% of the AI Index’s annual return (23.5% vs 25.0%) while reducing maximum drawdown by 17 percentage points.
Risks. Electricity futures are volatile (24.5% annualized since 2018; −57% peak-to-trough after 2022). Lower gas prices, mild weather, faster renewable buildout, AI efficiency gains, price caps and roll costs can all weigh on returns.
Conclusion. AI equities, data center construction and industrial metals have largely been priced, and AI equity valuations have returned to market levels. Electricity has not: demand is at record levels, PJM capacity auctions are capped and delayed, new supply is years away, and the investable forward curve remains well below its prior high. CNIC Funds and ICE intend to offer the 12-month U.S. electricity strategy to investors through a pending exchange-traded fund.
Important Disclosures
For institutional investors and financial professionals only. For informational purposes only; not investment advice, a recommendation, or an offer or solicitation to buy or sell any security. The exchange-traded fund referenced is pending; its registration statement has not become effective, its shares may not be sold, and offers to buy may not be accepted before effectiveness. Any offering will be made only by prospectus. Index performance excludes fees and costs, is not the performance of any fund, and is backtested and hypothetical for periods before the index launch date. Indices cannot be invested in directly. Portfolio combinations are hypothetical, constructed with the benefit of hindsight, and do not represent actual trading. Futures-based strategies involve significant risks, including volatility, roll costs, leverage and liquidity risk. Past performance is not indicative of future results. ICE and ICE U.S. Electricity Index are trademarks of Intercontinental Exchange, Inc. © 2026 CNIC Funds LLC.
CNIC Funds LLC | For institutional investors and financial professionals only | 5
