
1-mo Power Trade Lab: October 2026
All 20 backtested trades on the ICE 1-mo U.S. power index (ICEPPWRT), updated with settlement data through October 30, 2026
The 1-mo power index fell 12.9% in October, its largest monthly drop since February, and gave back most of its 2026 gain: it is now up 5.4% for the year, down from 21.0% at the end of September. The 12-mo index fell 3.2% (up 11.2% for the year). Natural gas (BCOMNGTR) lost 9.0% and is down 28.4% for the year, while BCOM WTI crude rallied 15.6%.
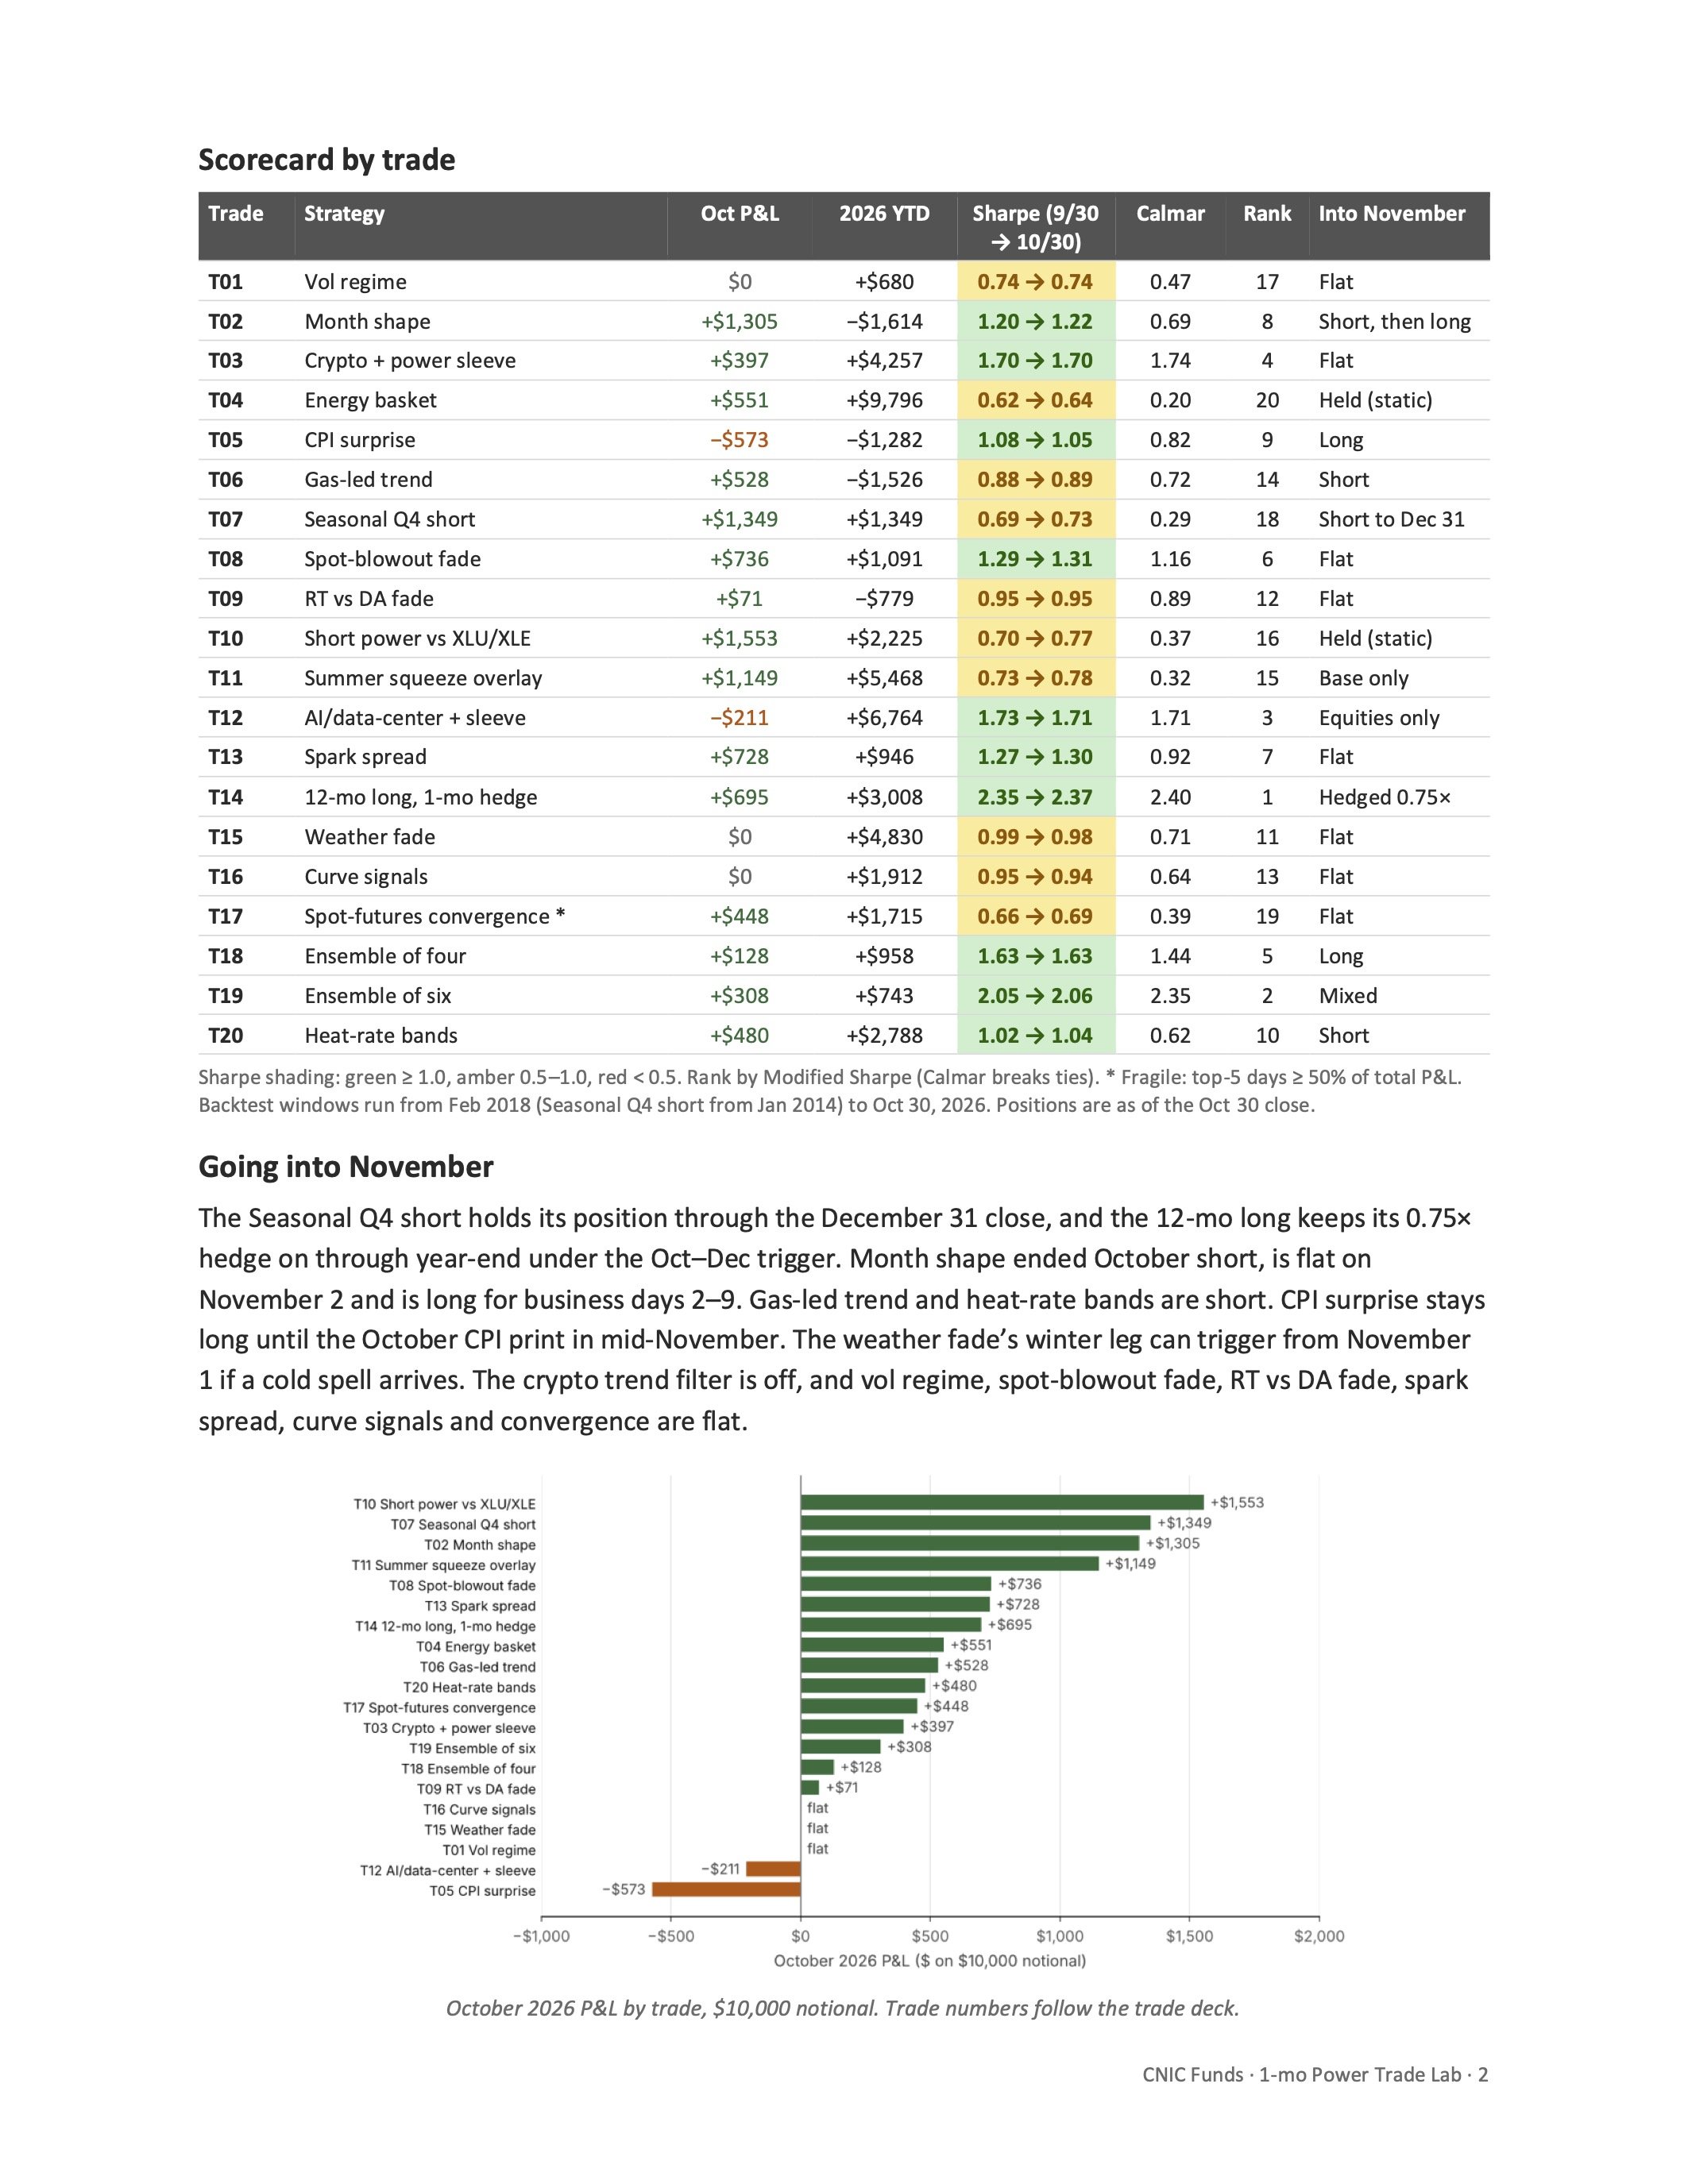
After a month in which a rising index cost the short-leaning trades money, October reversed it. Fifteen of the 20 strategies gained, two lost and three were flat. Five trades closed the month at record highs, and the top five rankings are unchanged.
Short-biased rules paid. The short power vs XLU/XLE trade made +$1,553, its fourth-best month on record, helped by a rally in utility and energy stocks. The Seasonal Q4 short made +$1,349 in the first month of its 2026 season. Month shape made +$1,305: the index rose 1.5% in its long window (business days 2–9) and fell 11.2% in its short window (business day 11 to month-end). The spot-blowout fade (+$736), spark spread (+$728) and 12-mo long with a 1-mo hedge (+$695) also gained.
Two trades lost. The CPI-surprise trade (−$573) went long after the September CPI print, released October 16, beat its seasonal norm by 0.36 points, and the index fell through the rest of the month. The AI/data-center pair (−$211) lost on its equity legs, which fell more than its power sleeve gained. Vol regime, weather fade and curve signals were flat because none of their triggers fired.
Scores edged up. Modified Sharpe changed by no more than 0.07 for any trade. The leaders are still the 12-mo long with a 1-mo hedge (2.37), the ensemble of six (2.06) and the AI/data-center pair with a power sleeve (1.71). Ten of 20 trades score 1.0 or better. Three trades near the bottom swapped places: the summer squeeze overlay moved up to 15th and short power vs XLU/XLE to 16th, while vol regime slipped to 17th. Spot-futures convergence is still the only trade flagged fragile (top-5-day share 51%).
How volatile is 1-mo power?
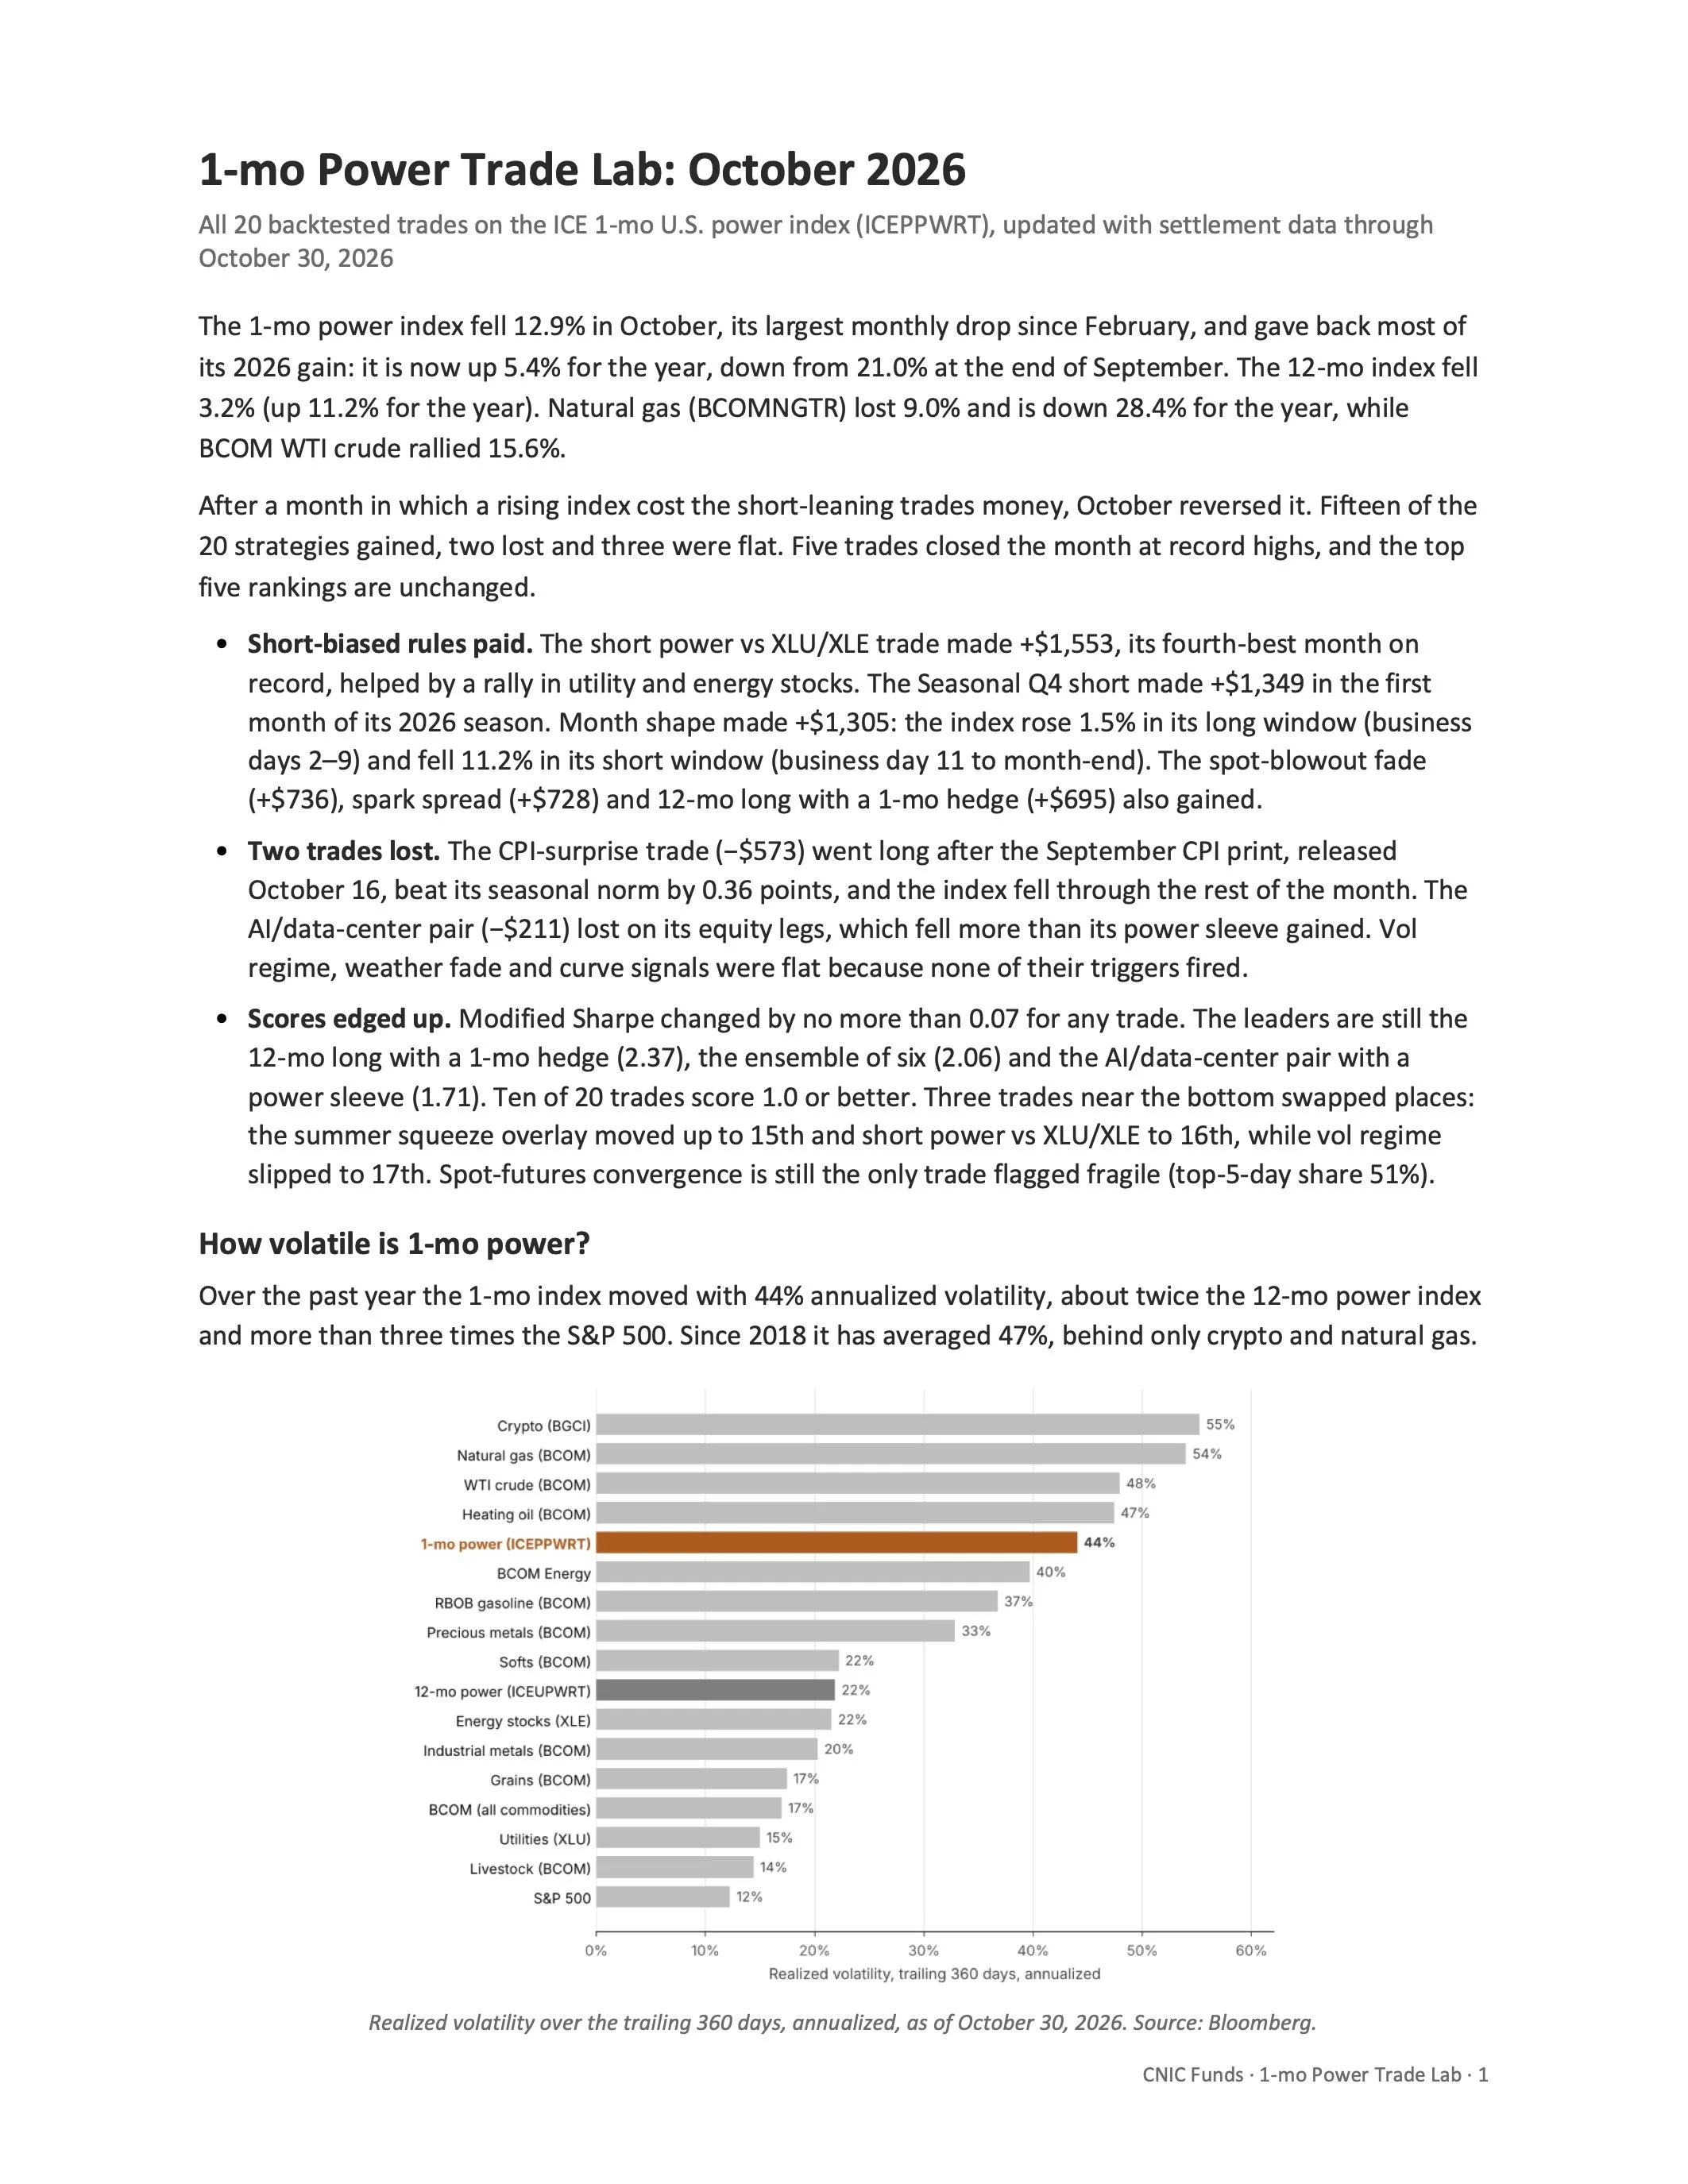
Over the past year the 1-mo index moved with 44% annualized volatility, about twice the 12-mo power index and more than three times the S&P 500. Since 2018 it has averaged 47%, behind only crypto and natural gas.
Realized volatility over the trailing 360 days, annualized, as of October 30, 2026. Source: Bloomberg.
CNIC Funds · 1-mo Power Trade Lab · 1
Scorecard by trade
T01 Vol regime
T02 Month shape
T03 Crypto + power sleeve
T04 Energy basket
T05 CPI surprise
T06 Gas-led trend
T07 Seasonal Q4 short
T08 Spot-blowout fade
T09 RT vs DA fade
T10 Short power vs XLU/XLE
T11 Summer squeeze overlay
T12 AI/data-center + sleeve
T13 Spark spread
T14 12-mo long, 1-mo hedge
T15 Weather fade
T16 Curve signals
T17 Spot-futures convergence *
T18 Ensemble of four
T19 Ensemble of six
T20 Heat-rate bands
Rank Into November
Trade
Strategy Oct P&L 2026 YTD Sharpe (9/30 → 10/30)
Calmar
0.74 → 0.74
1.20 → 1.22
1.70 → 1.70
0.62 → 0.64
1.08 → 1.05
0.88 → 0.89
0.69 → 0.73
1.29 → 1.31
0.95 → 0.95
0.70 → 0.77
0.73 → 0.78
1.73 → 1.71
1.27 → 1.30
2.35 → 2.37
0.99 → 0.98
0.95 → 0.94
0.66 → 0.69
1.63 → 1.63
2.05 → 2.06
1.02 → 1.04
$0 +$680 +$1,305 −$1,614 +$397 +$4,257 +$551 +$9,796 −$573 −$1,282 +$528 −$1,526 +$1,349 +$1,349 +$736 +$1,091
+$71 −$779 +$1,553 +$2,225 +$1,149 +$5,468
−$211 +$6,764 +$728 +$946 +$695 +$3,008
$0 +$4,830
$0 +$1,912 +$448 +$1,715 +$128 +$958 +$308 +$743 +$480 +$2,788
0.47 17 0.69 8 1.74 4 0.20 20 0.82 9 0.72 14 0.29 18 1.16 6 0.89 12 0.37 16 0.32 15 1.71 3 0.92 7 2.40 1 0.71 11 0.64 13 0.39 19 1.44 5 2.35 2 0.62 10
Flat
Short, then long Flat
Held (static) Long
Short
Short to Dec 31 Flat
Flat
Held (static) Base only Equities only Flat
Hedged 0.75× Flat
Flat
Flat
Long
Mixed
Short
Sharpe shading: green ≥ 1.0, amber 0.5–1.0, red < 0.5. Rank by Modified Sharpe (Calmar breaks ties). * Fragile: top-5 days ≥ 50% of total P&L. Backtest windows run from Feb 2018 (Seasonal Q4 short from Jan 2014) to Oct 30, 2026. Positions are as of the Oct 30 close.
Going into November
The Seasonal Q4 short holds its position through the December 31 close, and the 12-mo long keeps its 0.75× hedge on through year-end under the Oct–Dec trigger. Month shape ended October short, is flat on November 2 and is long for business days 2–9. Gas-led trend and heat-rate bands are short. CPI surprise stays long until the October CPI print in mid-November. The weather fade’s winter leg can trigger from November 1 if a cold spell arrives. The crypto trend filter is off, and vol regime, spot-blowout fade, RT vs DA fade, spark spread, curve signals and convergence are flat.
October 2026 P&L by trade, $10,000 notional. Trade numbers follow the trade deck.
CNIC Funds · 1-mo Power Trade Lab · 2
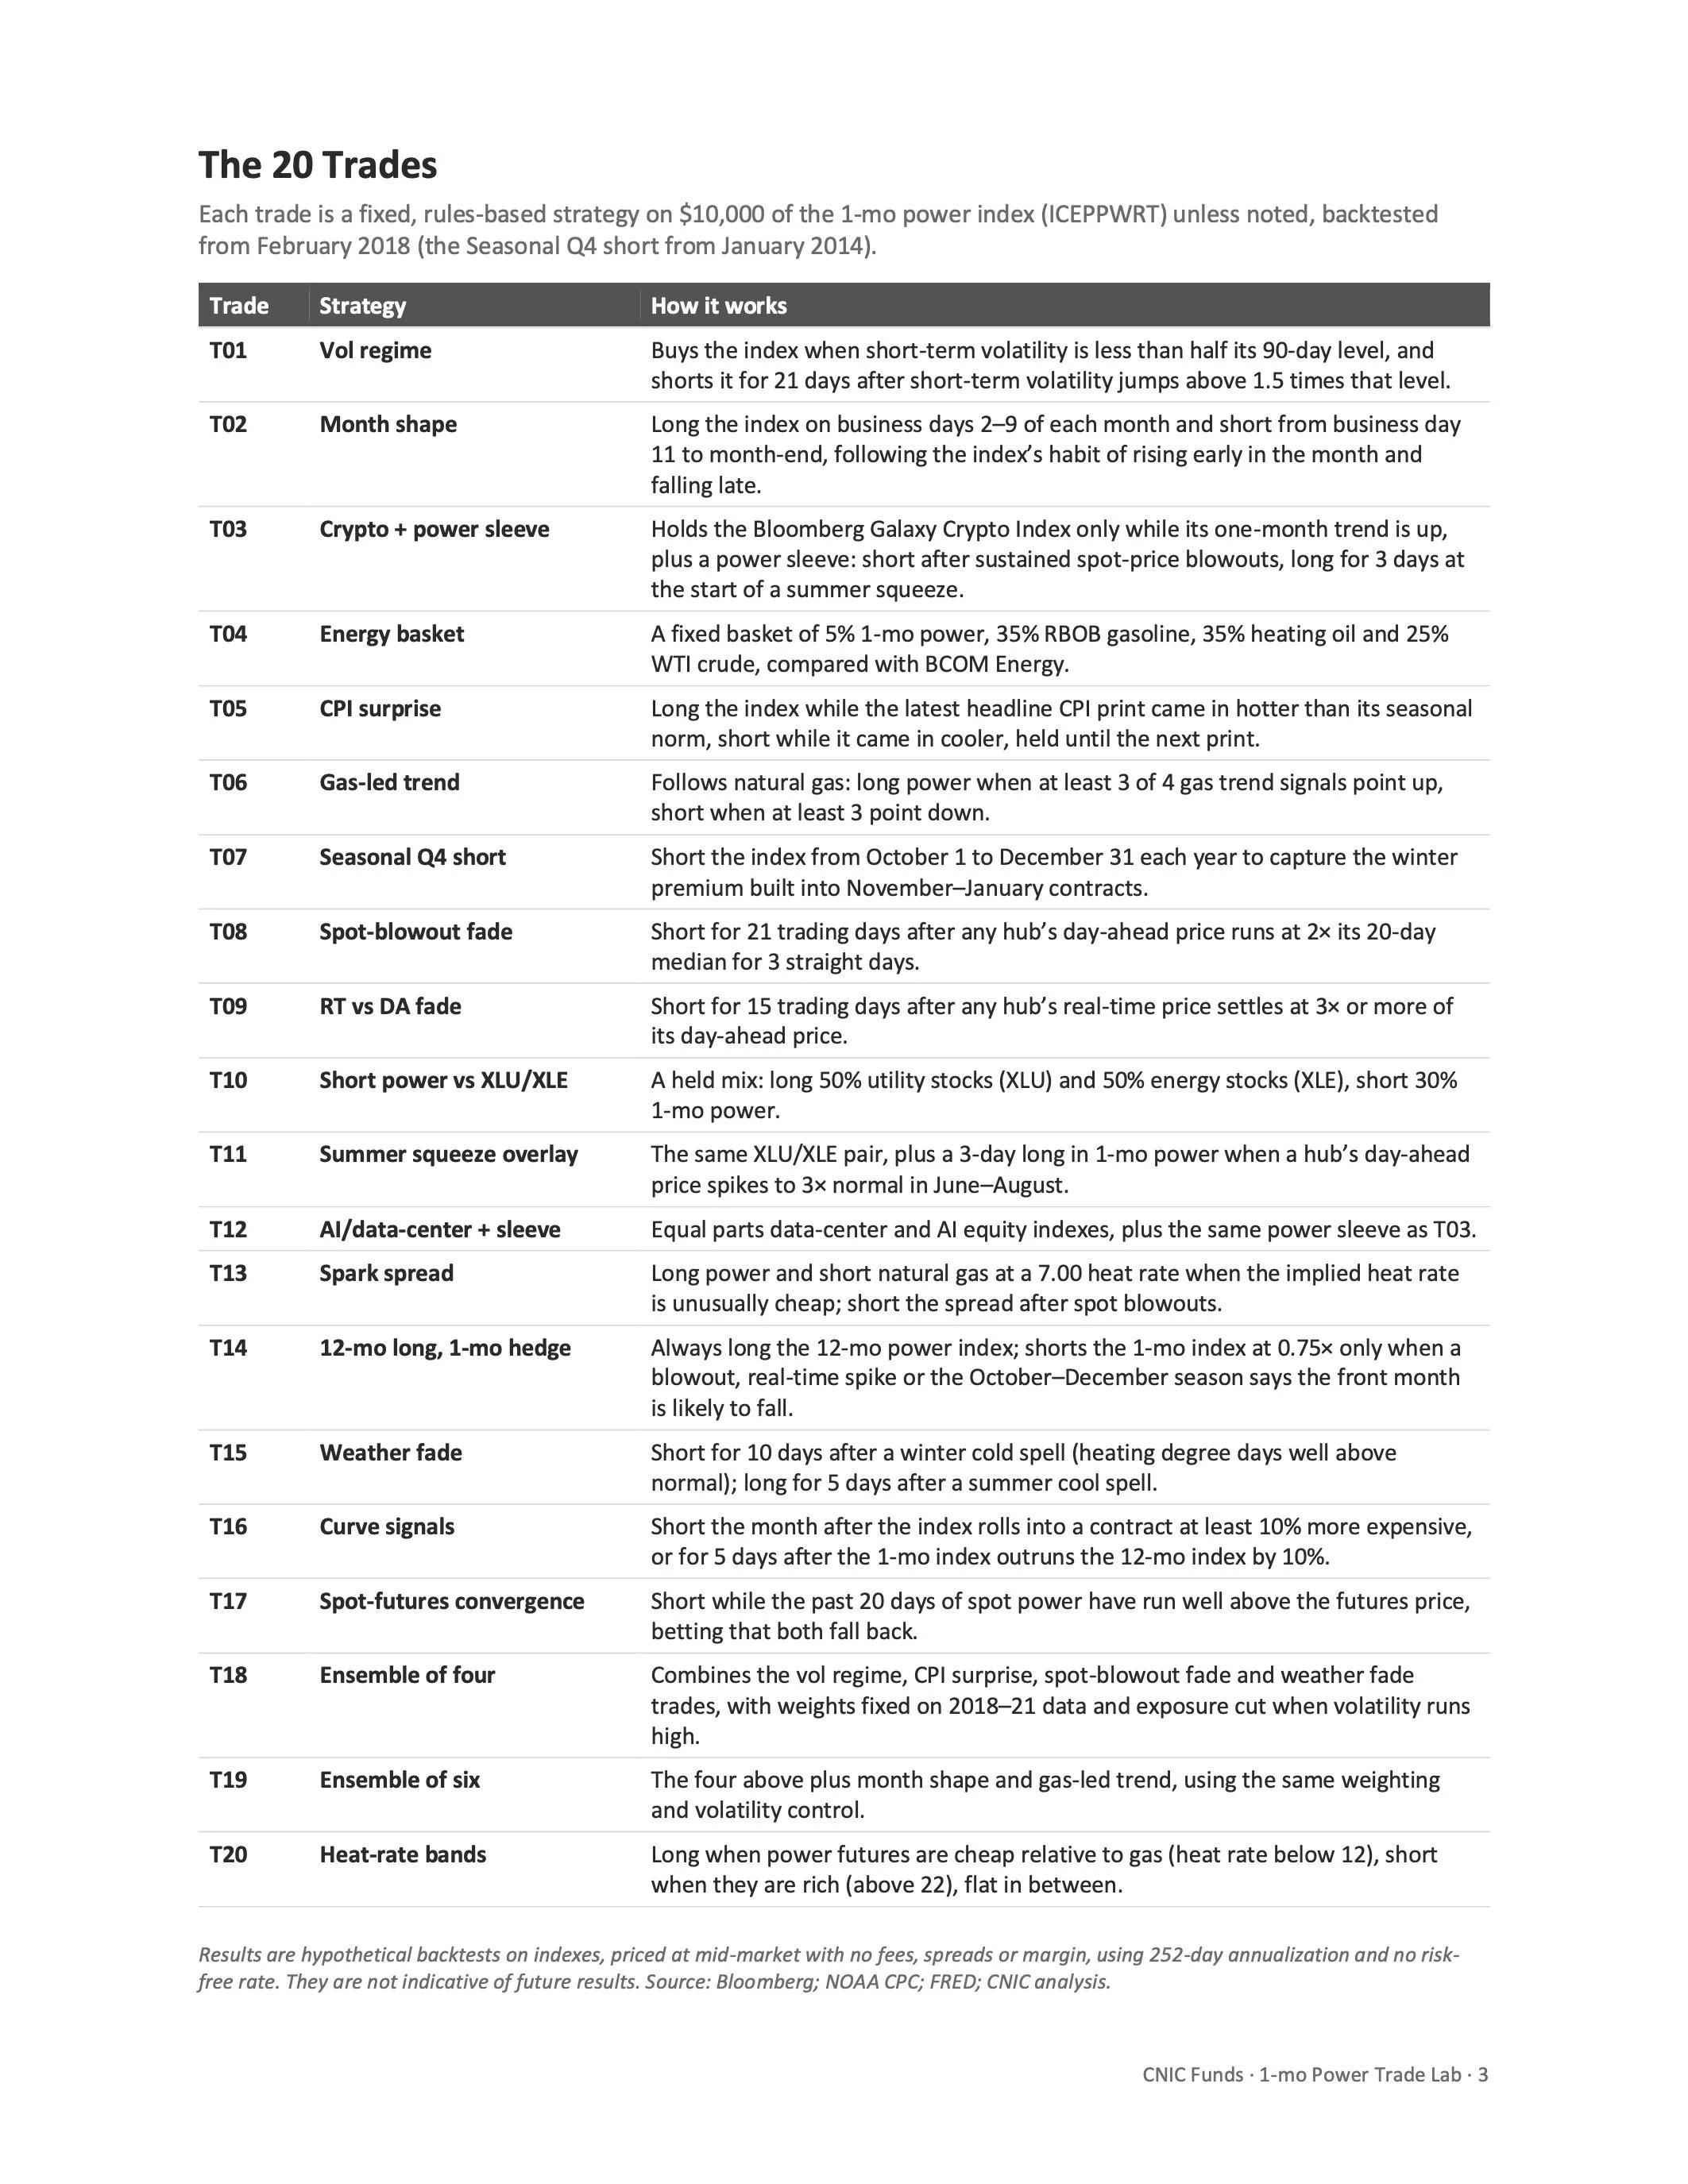
The 20 Trades
Each trade is a fixed, rules-based strategy on $10,000 of the 1-mo power index (ICEPPWRT) unless noted, backtested from February 2018 (the Seasonal Q4 short from January 2014).
Trade
Strategy How it works
T01 Vol regime
T02 Month shape
T03 Crypto + power sleeve
T04 Energy basket
T05 CPI surprise
T06 Gas-led trend
T07 Seasonal Q4 short
T08 Spot-blowout fade
T09 RT vs DA fade
T10 Short power vs XLU/XLE
T11 Summer squeeze overlay
T12 AI/data-center + sleeve
T13 Spark spread
T14 12-mo long, 1-mo hedge
T15 Weather fade
T16 Curve signals
T17 Spot-futures convergence
T18 Ensemble of four
T19 Ensemble of six
T20 Heat-rate bands
Buys the index when short-term volatility is less than half its 90-day level, and shorts it for 21 days after short-term volatility jumps above 1.5 times that level.
Long the index on business days 2–9 of each month and short from business day 11 to month-end, following the index’s habit of rising early in the month and falling late.
Holds the Bloomberg Galaxy Crypto Index only while its one-month trend is up, plus a power sleeve: short after sustained spot-price blowouts, long for 3 days at the start of a summer squeeze.
A fixed basket of 5% 1-mo power, 35% RBOB gasoline, 35% heating oil and 25% WTI crude, compared with BCOM Energy.
Long the index while the latest headline CPI print came in hotter than its seasonal norm, short while it came in cooler, held until the next print.
Follows natural gas: long power when at least 3 of 4 gas trend signals point up, short when at least 3 point down.
Short the index from October 1 to December 31 each year to capture the winter premium built into November–January contracts.
Short for 21 trading days after any hub’s day-ahead price runs at 2× its 20-day median for 3 straight days.
Short for 15 trading days after any hub’s real-time price settles at 3× or more of its day-ahead price.
A held mix: long 50% utility stocks (XLU) and 50% energy stocks (XLE), short 30% 1-mo power.
The same XLU/XLE pair, plus a 3-day long in 1-mo power when a hub’s day-ahead price spikes to 3× normal in June–August.
Equal parts data-center and AI equity indexes, plus the same power sleeve as T03.
Long power and short natural gas at a 7.00 heat rate when the implied heat rate is unusually cheap; short the spread after spot blowouts.
Always long the 12-mo power index; shorts the 1-mo index at 0.75× only when a blowout, real-time spike or the October–December season says the front month is likely to fall.
Short for 10 days after a winter cold spell (heating degree days well above normal); long for 5 days after a summer cool spell.
Short the month after the index rolls into a contract at least 10% more expensive, or for 5 days after the 1-mo index outruns the 12-mo index by 10%.
Short while the past 20 days of spot power have run well above the futures price, betting that both fall back.
Combines the vol regime, CPI surprise, spot-blowout fade and weather fade trades, with weights fixed on 2018–21 data and exposure cut when volatility runs high.
The four above plus month shape and gas-led trend, using the same weighting and volatility control.
Long when power futures are cheap relative to gas (heat rate below 12), short when they are rich (above 22), flat in between.
Results are hypothetical backtests on indexes, priced at mid-market with no fees, spreads or margin, using 252-day annualization and no risk- free rate. They are not indicative of future results. Source: Bloomberg; NOAA CPC; FRED; CNIC analysis.
CNIC Funds · 1-mo Power Trade Lab · 3
