
EL NIÑO vs POWER PRICES · MONTHLY UPDATE
October 2026
Long Jul-27 / Aug-27 PJM Western Hub on-peak · markets as of 30 October 2026 · ENSO as of 8 October 2026
Summary
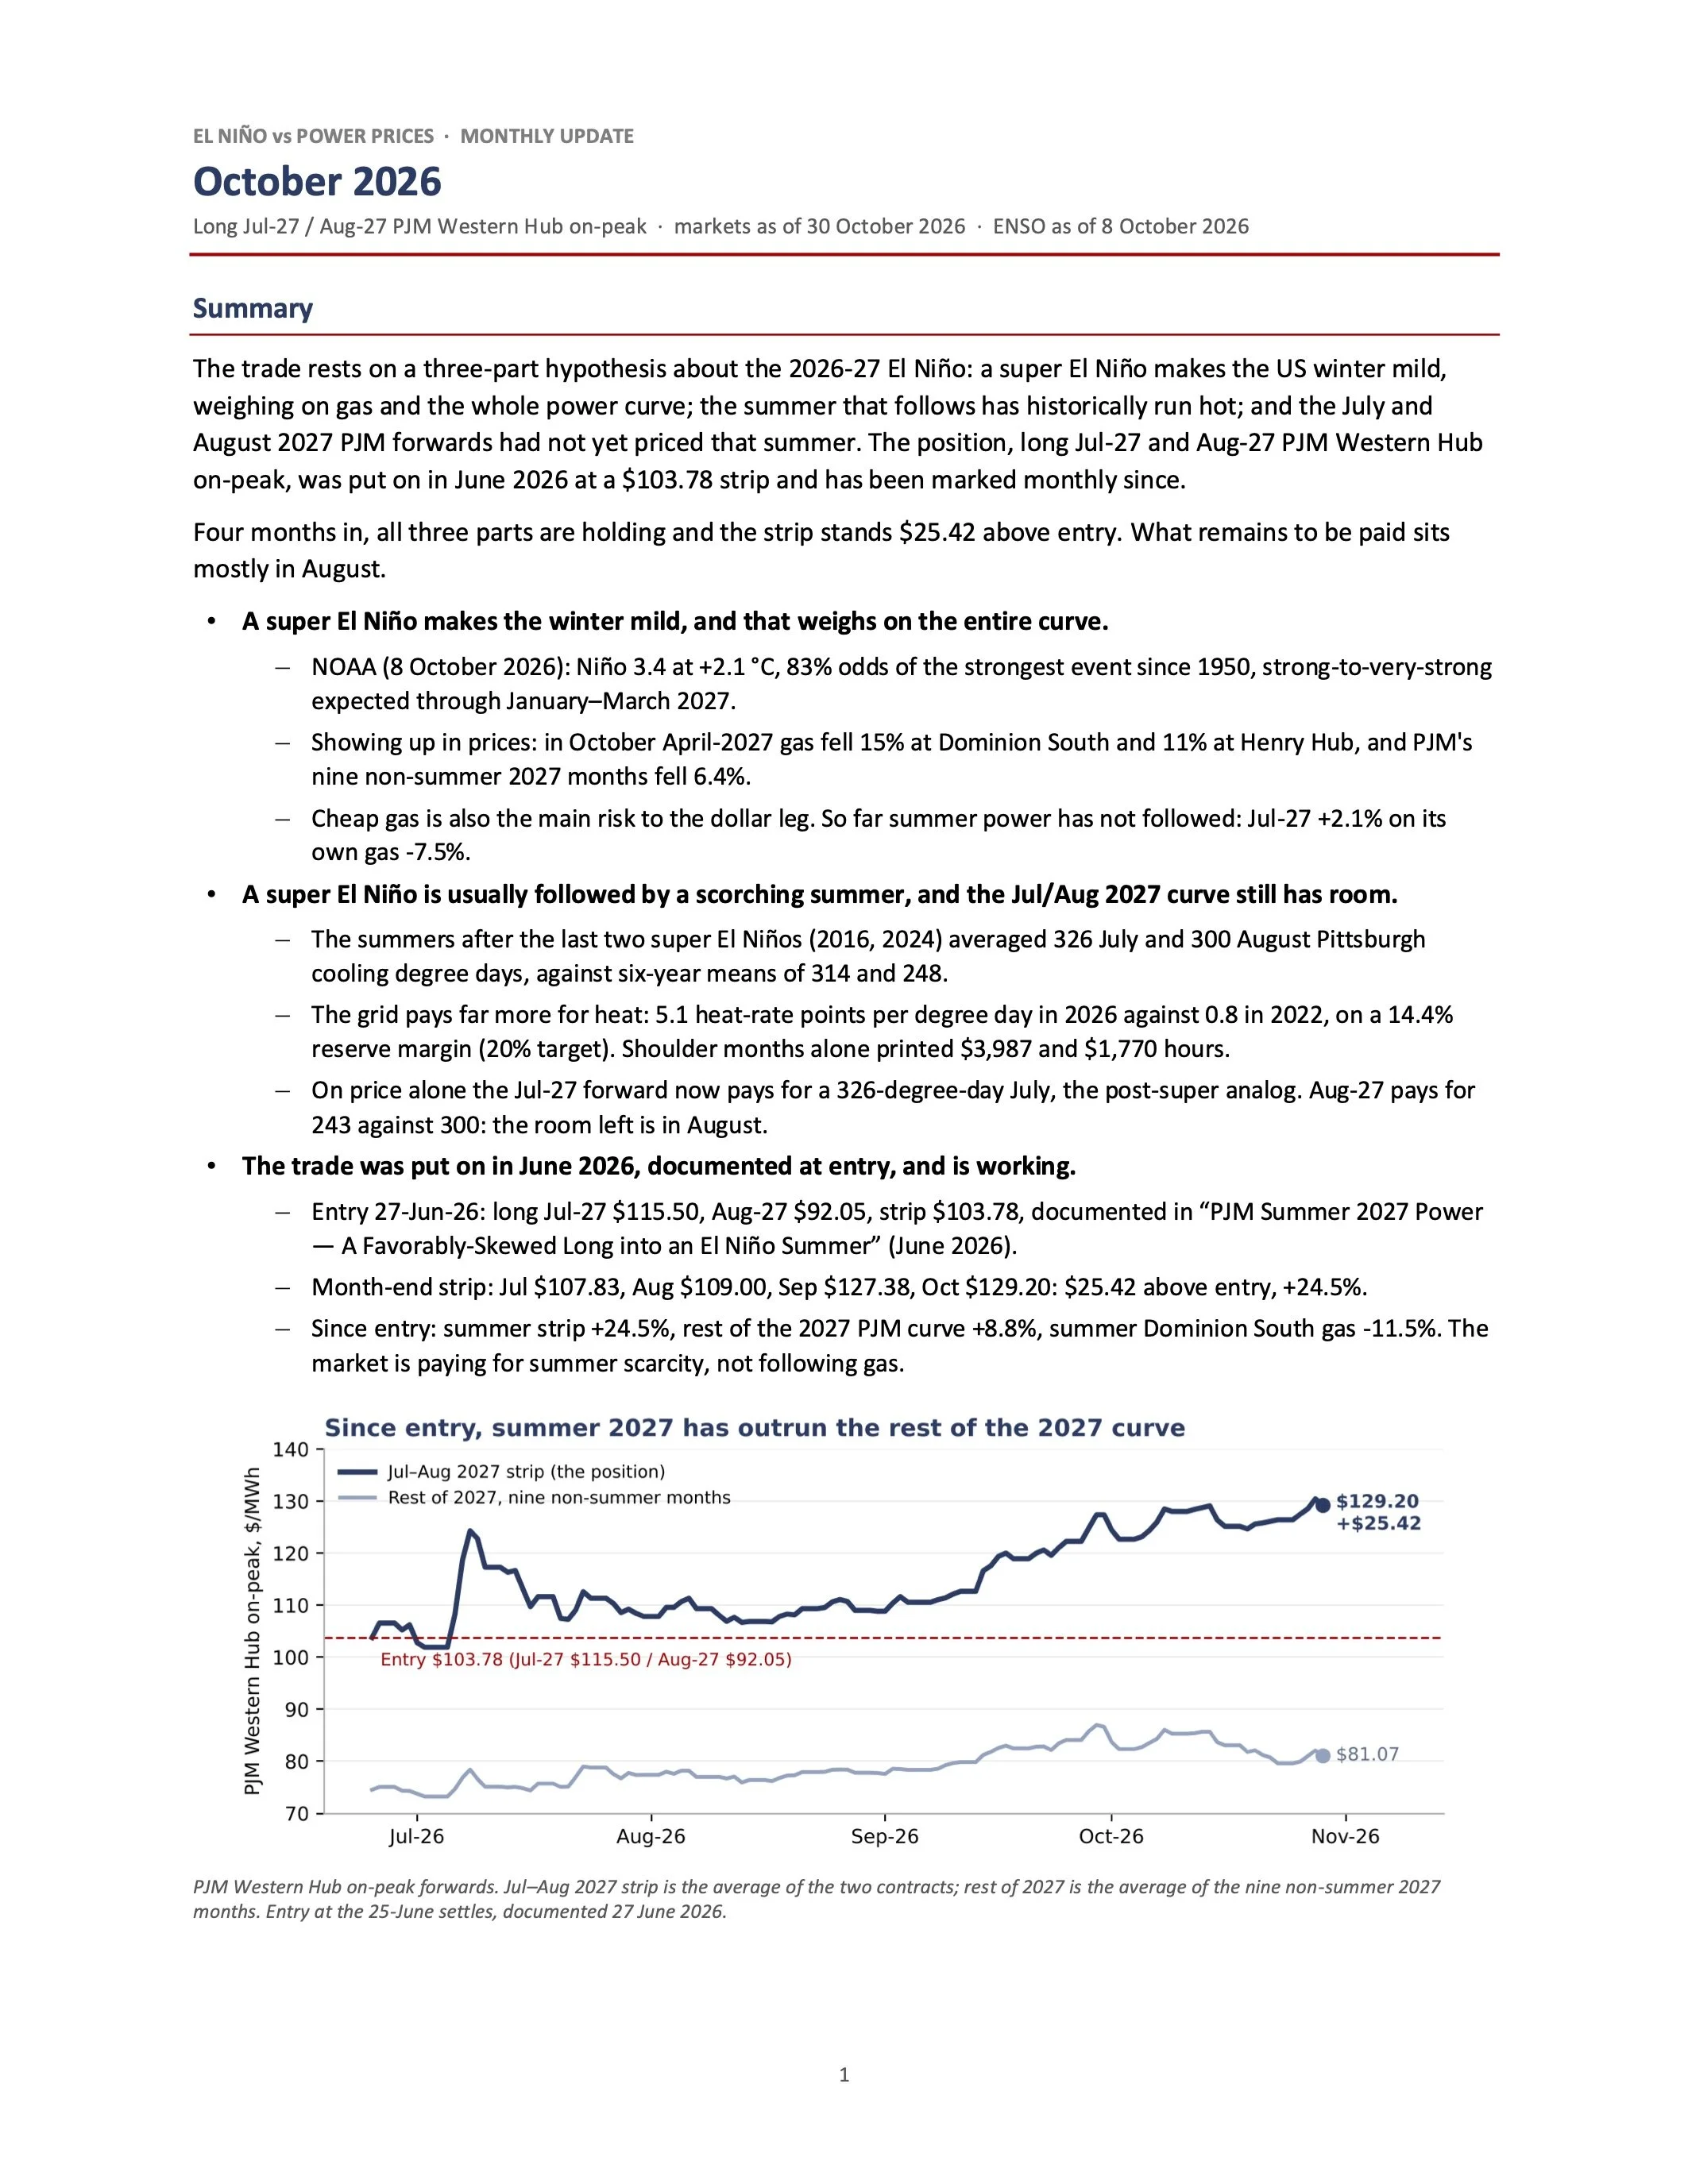
The trade rests on a three-part hypothesis about the 2026-27 El Niño: a super El Niño makes the US winter mild, weighing on gas and the whole power curve; the summer that follows has historically run hot; and the July and August 2027 PJM forwards had not yet priced that summer. The position, long Jul-27 and Aug-27 PJM Western Hub on-peak, was put on in June 2026 at a $103.78 strip and has been marked monthly since.
Four months in, all three parts are holding and the strip stands $25.42 above entry. What remains to be paid sits mostly in August.
A super El Niño makes the winter mild, and that weighs on the entire curve.
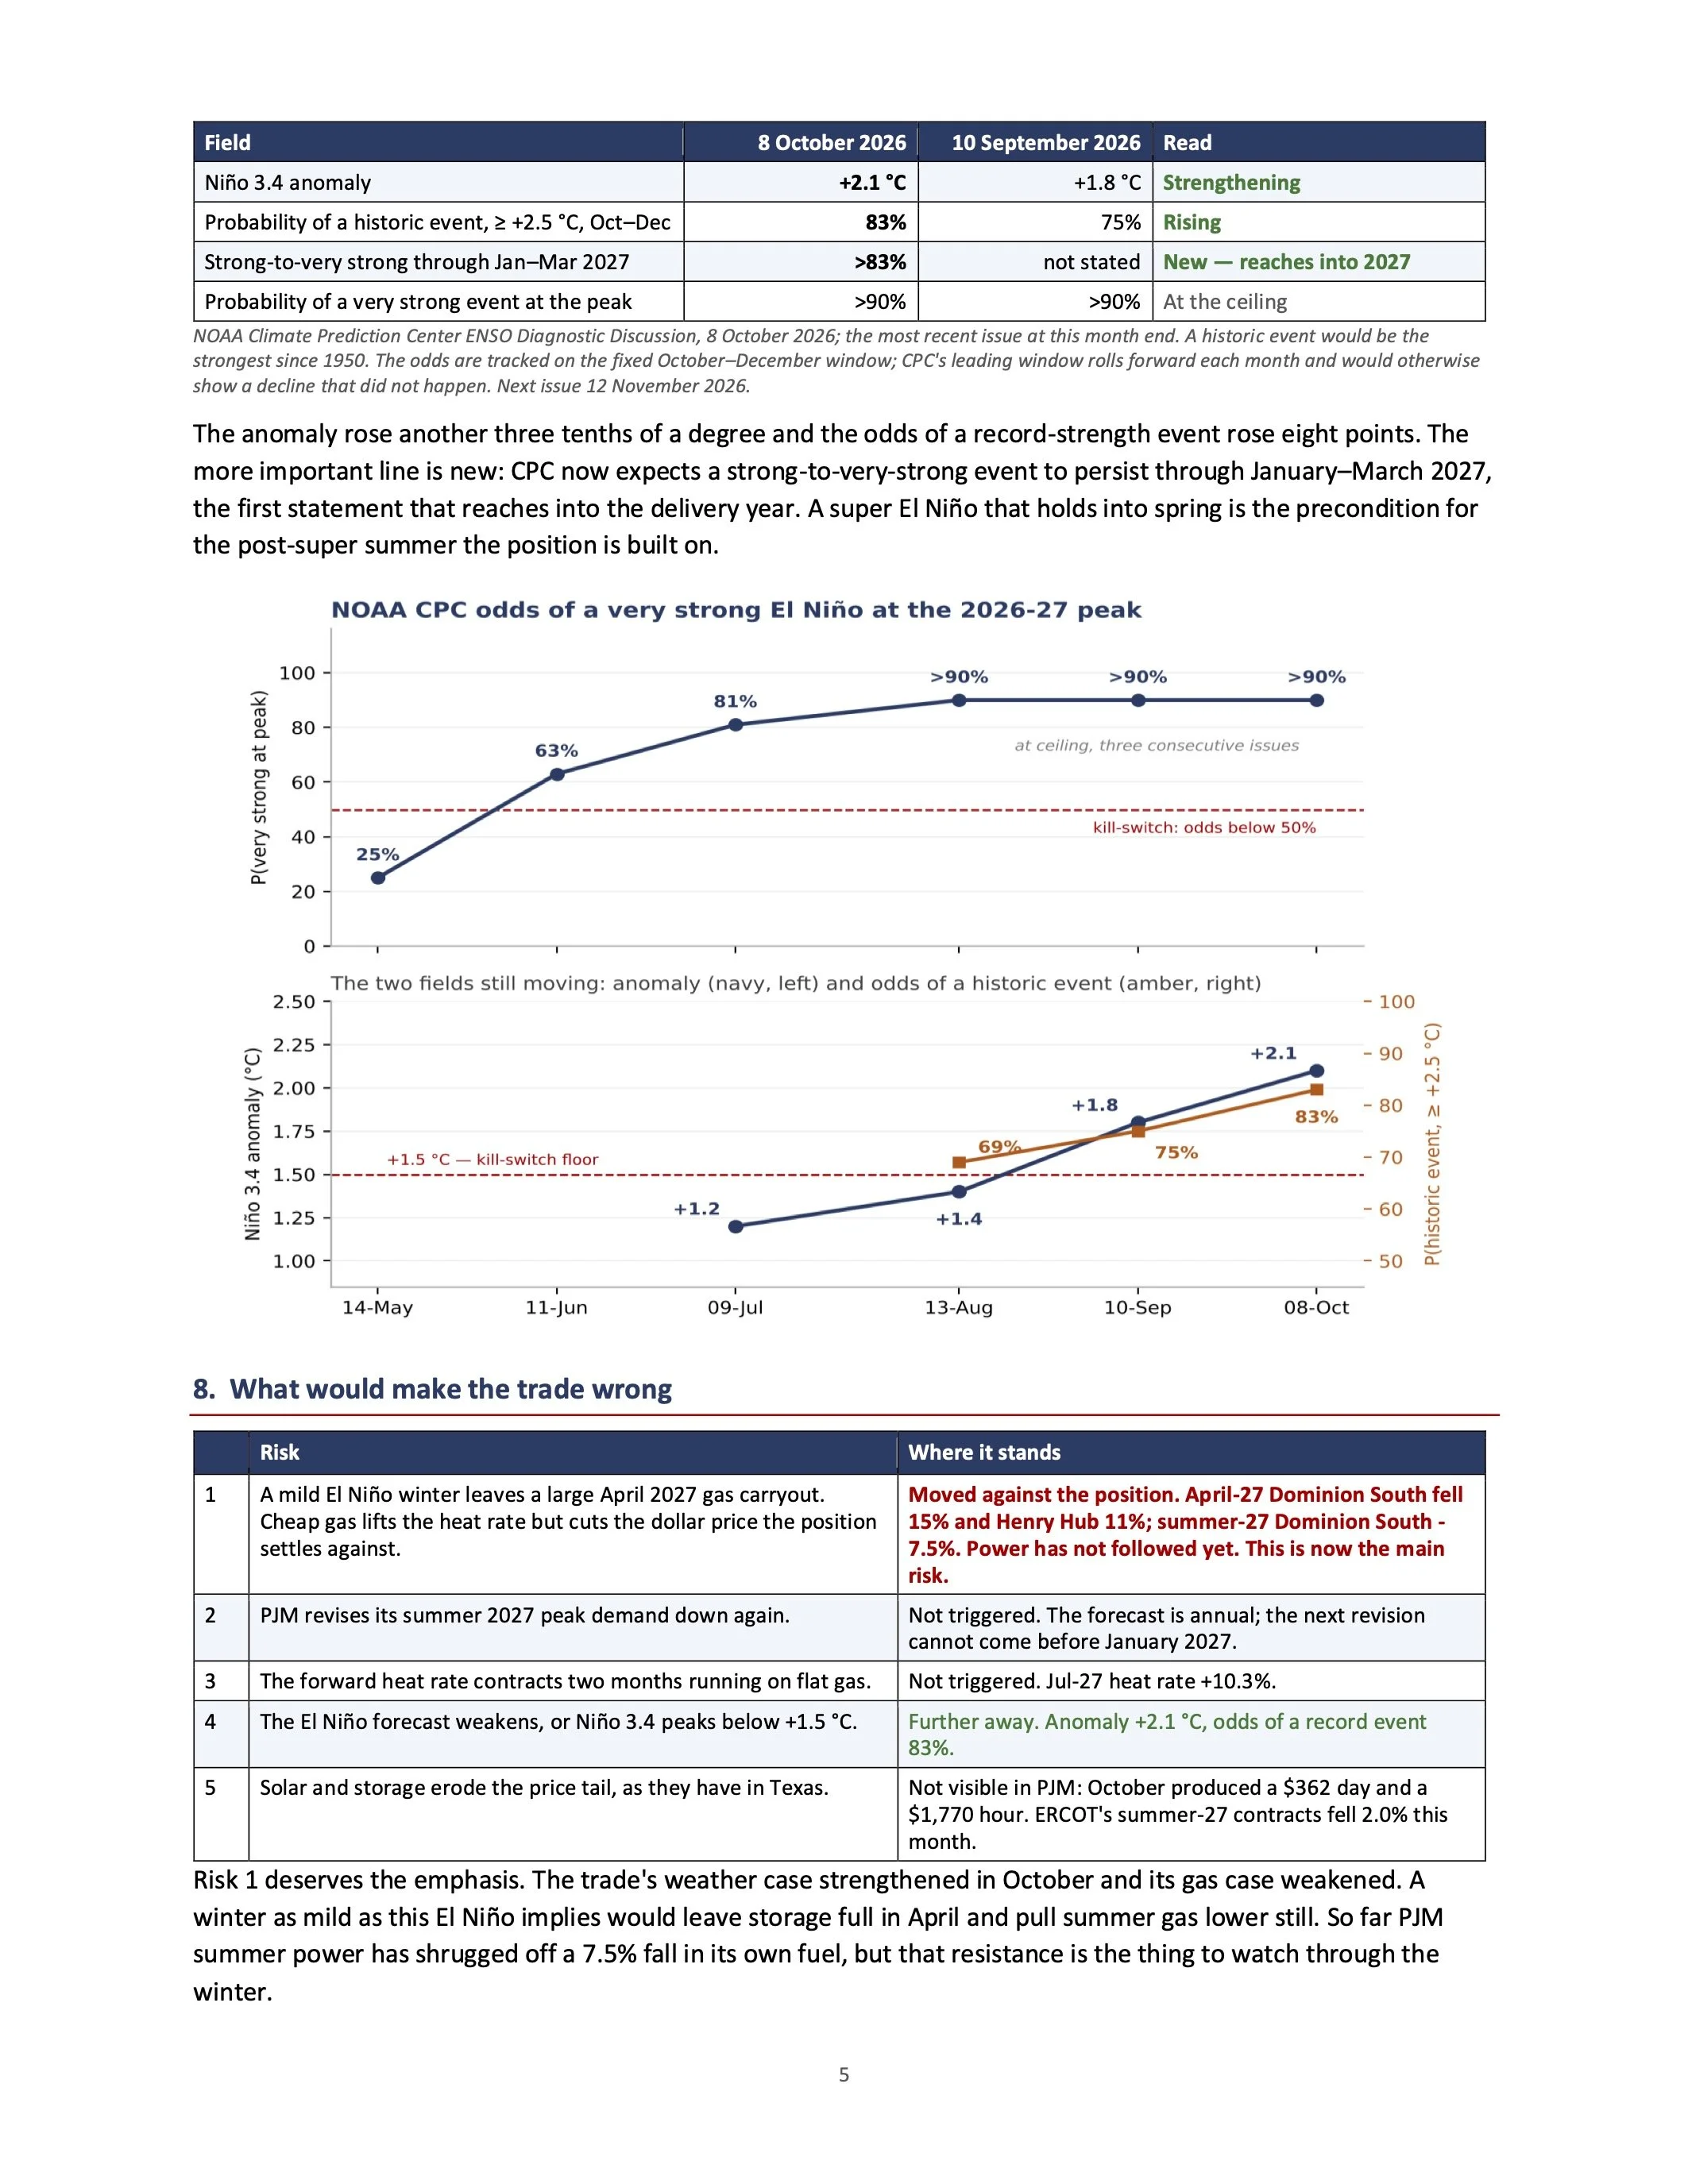
– NOAA (8 October 2026): Niño 3.4 at +2.1 °C, 83% odds of the strongest event since 1950, strong-to-very-strong
expected through January–March 2027.
– Showing up in prices: in October April-2027 gas fell 15% at Dominion South and 11% at Henry Hub, and PJM's nine non-summer 2027 months fell 6.4%.
– Cheap gas is also the main risk to the dollar leg. So far summer power has not followed: Jul-27 +2.1% on its own gas -7.5%.
A super El Niño is usually followed by a scorching summer, and the Jul/Aug 2027 curve still has room.
– The summers after the last two super El Niños (2016, 2024) averaged 326 July and 300 August Pittsburgh
cooling degree days, against six-year means of 314 and 248.
– The grid pays far more for heat: 5.1 heat-rate points per degree day in 2026 against 0.8 in 2022, on a 14.4% reserve margin (20% target). Shoulder months alone printed $3,987 and $1,770 hours.
– On price alone the Jul-27 forward now pays for a 326-degree-day July, the post-super analog. Aug-27 pays for 243 against 300: the room left is in August.
The trade was put on in June 2026, documented at entry, and is working.
– Entry 27-Jun-26: long Jul-27 $115.50, Aug-27 $92.05, strip $103.78, documented in “PJM Summer 2027 Power
— A Favorably-Skewed Long into an El Niño Summer” (June 2026).
– Month-end strip: Jul $107.83, Aug $109.00, Sep $127.38, Oct $129.20: $25.42 above entry, +24.5%.
– Since entry: summer strip +24.5%, rest of the 2027 PJM curve +8.8%, summer Dominion South gas -11.5%. The market is paying for summer scarcity, not following gas.
PJM Western Hub on-peak forwards. Jul–Aug 2027 strip is the average of the two contracts; rest of 2027 is the average of the nine non-summer 2027 months. Entry at the 25-June settles, documented 27 June 2026.
1
The month, and where it stands
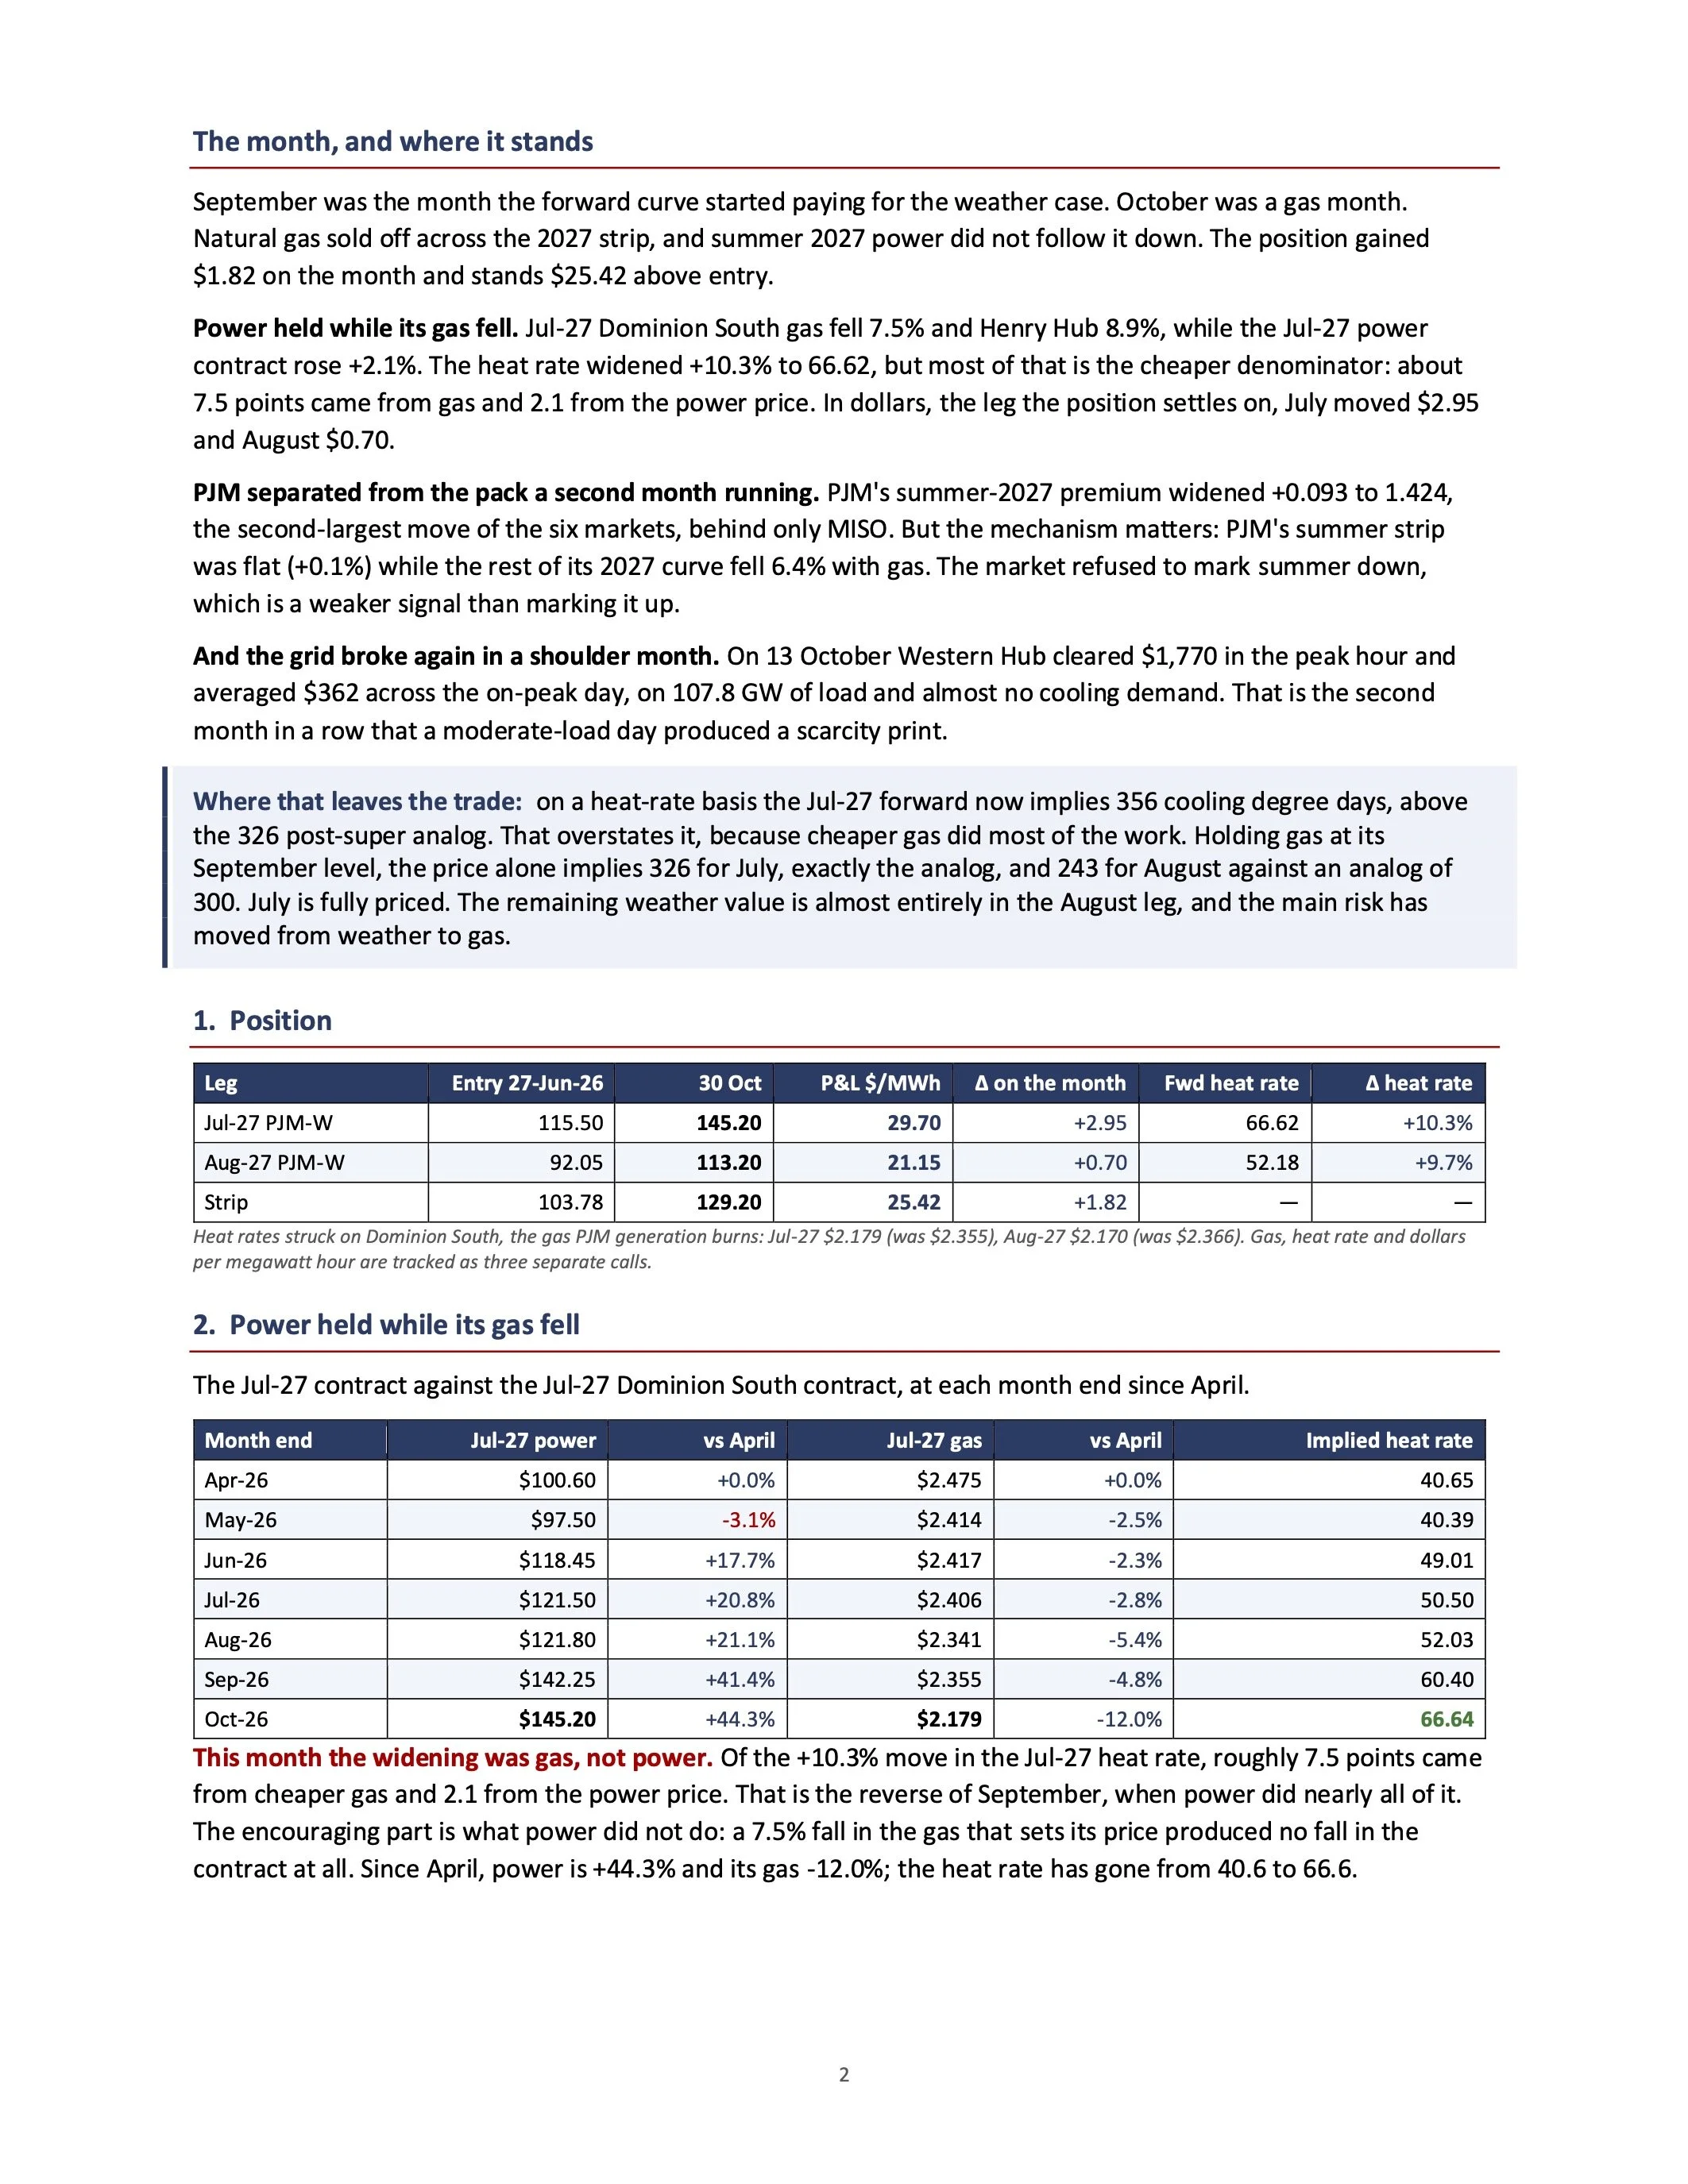
September was the month the forward curve started paying for the weather case. October was a gas month. Natural gas sold off across the 2027 strip, and summer 2027 power did not follow it down. The position gained $1.82 on the month and stands $25.42 above entry.
Power held while its gas fell. Jul-27 Dominion South gas fell 7.5% and Henry Hub 8.9%, while the Jul-27 power contract rose +2.1%. The heat rate widened +10.3% to 66.62, but most of that is the cheaper denominator: about 7.5 points came from gas and 2.1 from the power price. In dollars, the leg the position settles on, July moved $2.95 and August $0.70.
PJM separated from the pack a second month running. PJM's summer-2027 premium widened +0.093 to 1.424, the second-largest move of the six markets, behind only MISO. But the mechanism matters: PJM's summer strip was flat (+0.1%) while the rest of its 2027 curve fell 6.4% with gas. The market refused to mark summer down, which is a weaker signal than marking it up.
And the grid broke again in a shoulder month. On 13 October Western Hub cleared $1,770 in the peak hour and averaged $362 across the on-peak day, on 107.8 GW of load and almost no cooling demand. That is the second month in a row that a moderate-load day produced a scarcity print.
1. Position
Jul-27 PJM-W 115.50 145.20 29.70 +2.95 66.62 +10.3%
Strip 103.78 129.20 25.42 +1.82 — — Heat rates struck on Dominion South, the gas PJM generation burns: Jul-27 $2.179 (was $2.355), Aug-27 $2.170 (was $2.366). Gas, heat rate and dollars
Where that leaves the trade: on a heat-rate basis the Jul-27 forward now implies 356 cooling degree days, above the 326 post-super analog. That overstates it, because cheaper gas did most of the work. Holding gas at its September level, the price alone implies 326 for July, exactly the analog, and 243 for August against an analog of 300. July is fully priced. The remaining weather value is almost entirely in the August leg, and the main risk has moved from weather to gas.
Leg
Entry 27-Jun-26
30 Oct
P&L $/MWh
Δ on the month
Fwd heat rate
Δ heat rate
Aug-27 PJM-W
92.05
113.20
21.15
+0.70
52.18
+9.7%
per megawatt hour are tracked as three separate calls.
2. Power held while its gas fell
The Jul-27 contract against the Jul-27 Dominion South contract, at each month end since April.
Month end
Jul-27 power
vs April
Jul-27 gas
vs April
Implied heat rate
Apr-26 $100.60 +0.0%
Jun-26 $118.45 +17.7%
Aug-26 $121.80 +21.1%
$2.475 +0.0% $2.417 -2.3% $2.341 -5.4% $2.179 -12.0%
40.65 49.01 52.03 66.64
May-26
$97.50
-3.1%
$2.414
-2.5%
40.39
Jul-26
$121.50
+20.8%
$2.406
-2.8%
50.50
Sep-26
$142.25
+41.4%
$2.355
-4.8%
60.40
Oct-26 $145.20 +44.3%
This month the widening was gas, not power. Of the +10.3% move in the Jul-27 heat rate, roughly 7.5 points came from cheaper gas and 2.1 from the power price. That is the reverse of September, when power did nearly all of it. The encouraging part is what power did not do: a 7.5% fall in the gas that sets its price produced no fall in the contract at all. Since April, power is +44.3% and its gas -12.0%; the heat rate has gone from 40.6 to 66.6.
2
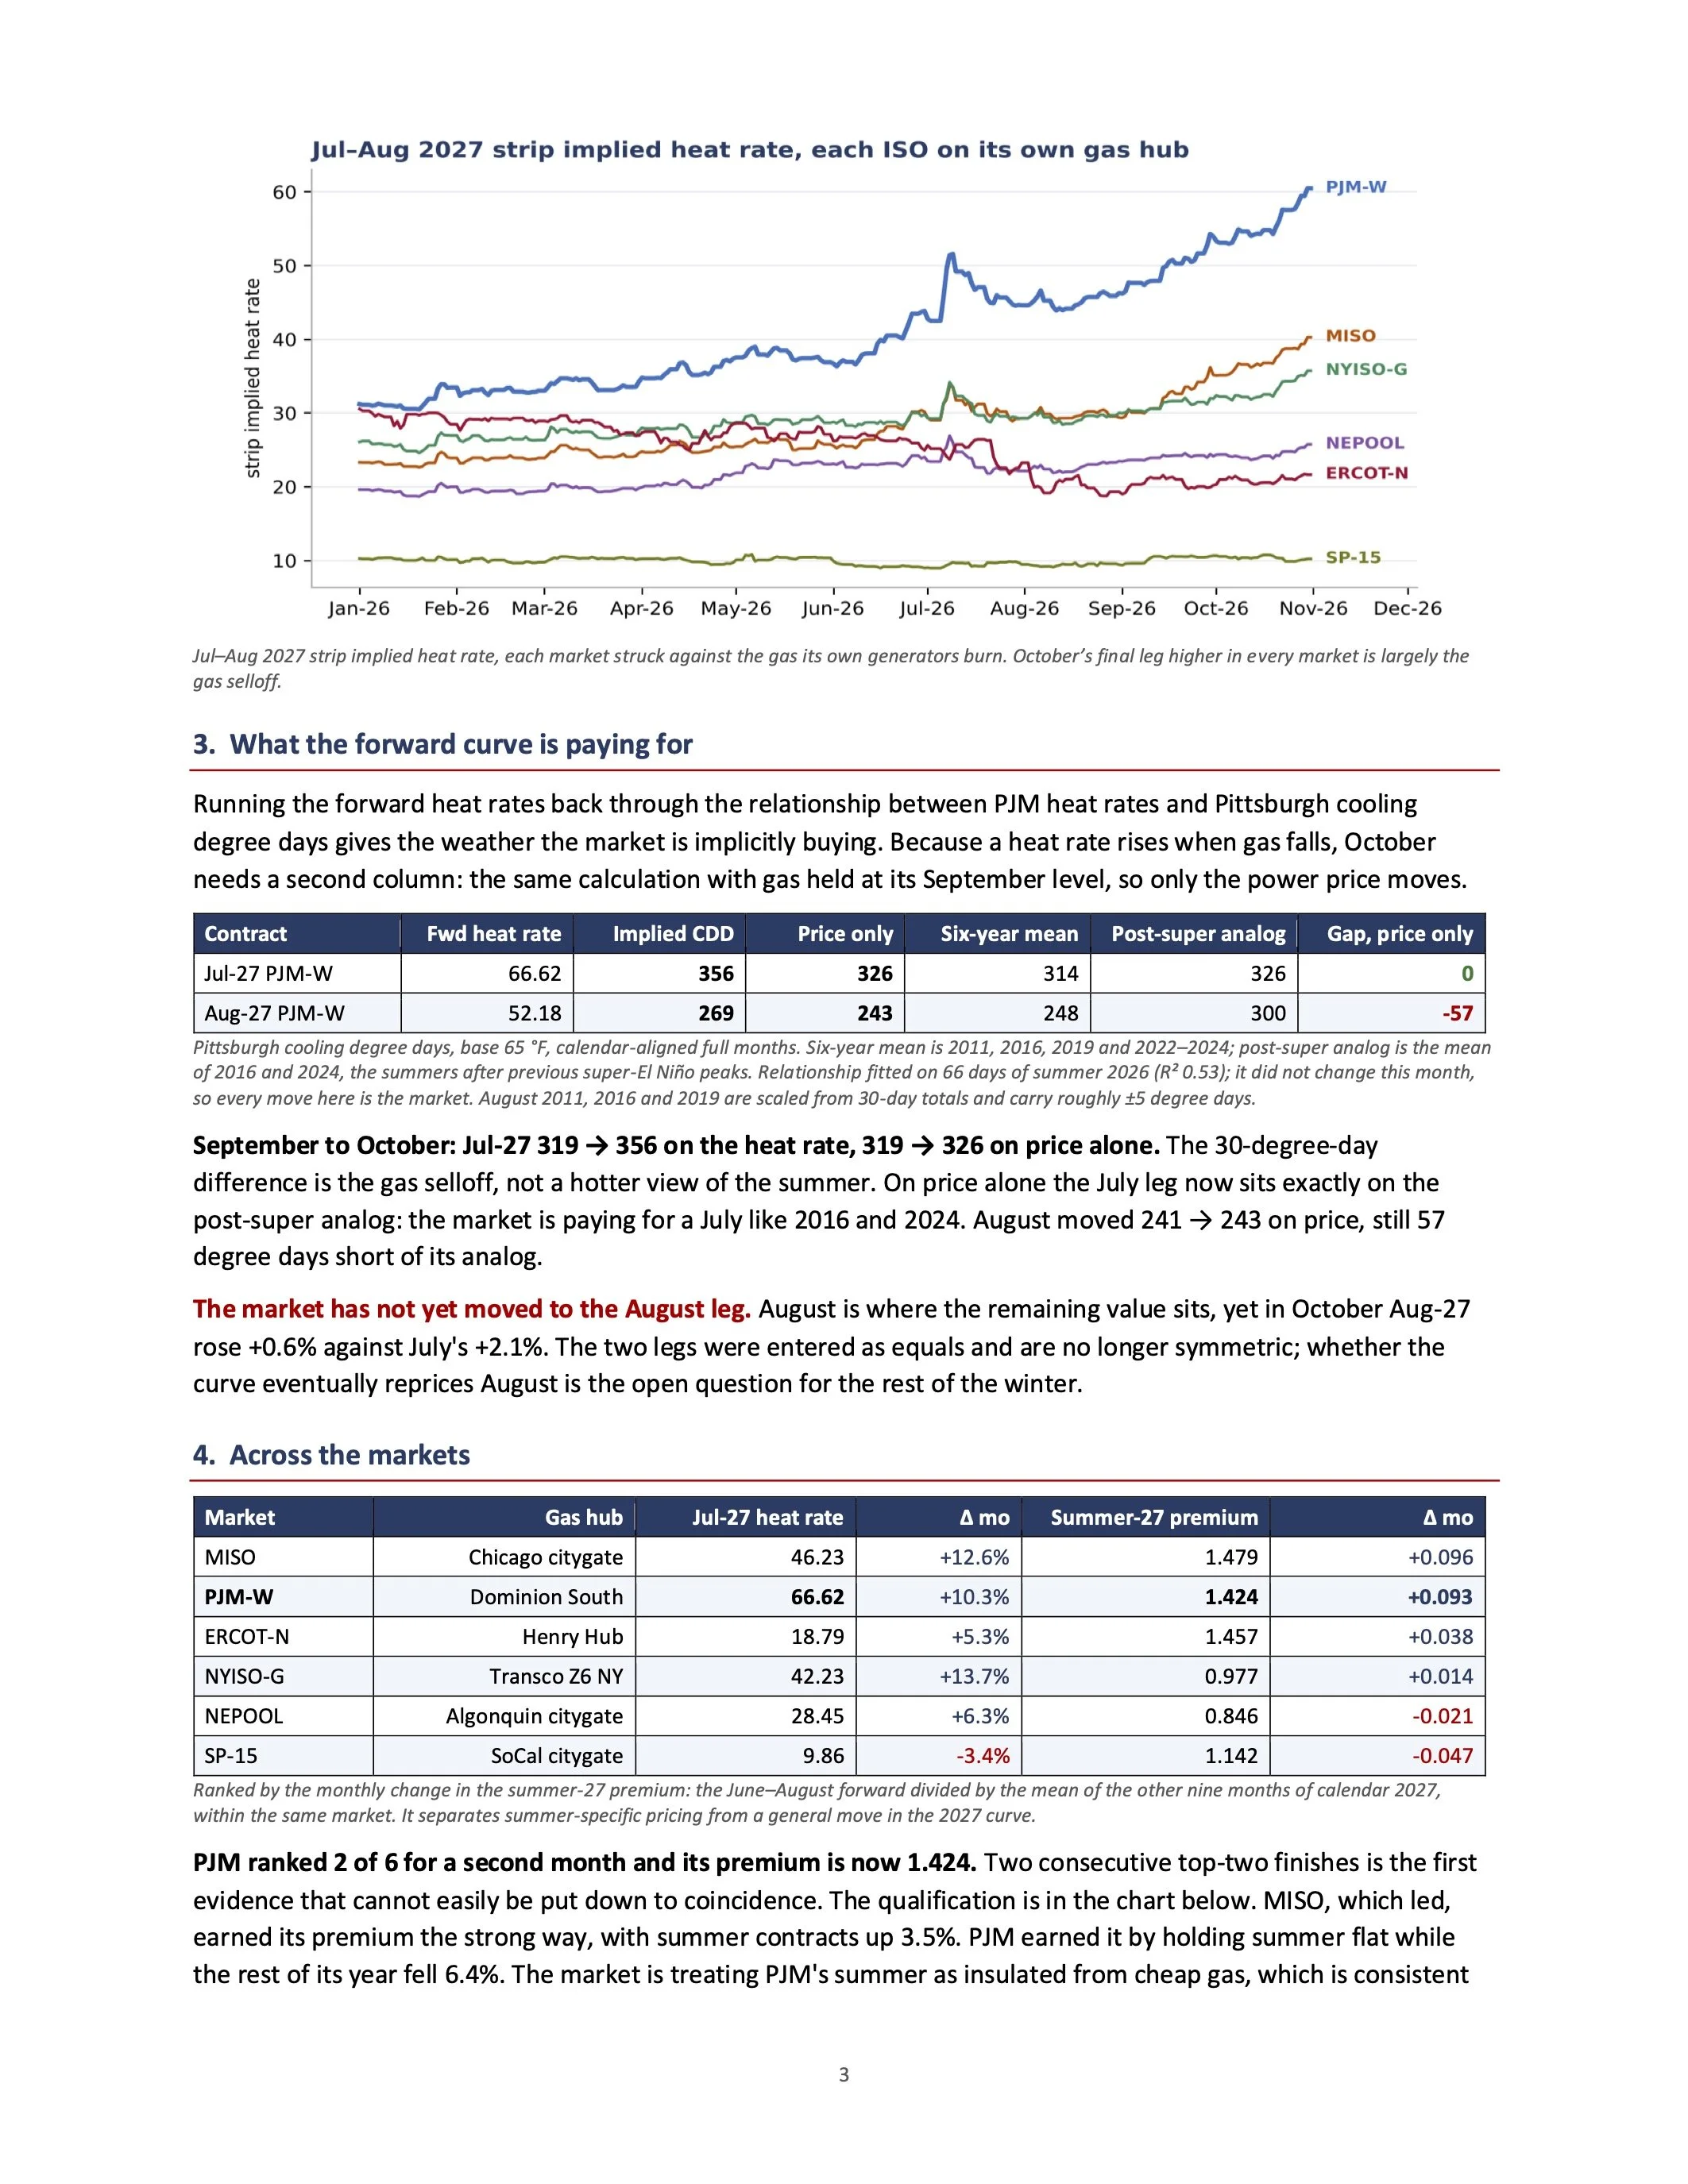
Jul–Aug 2027 strip implied heat rate, each market struck against the gas its own generators burn. October’s final leg higher in every market is largely the gas selloff.
3. What the forward curve is paying for
Running the forward heat rates back through the relationship between PJM heat rates and Pittsburgh cooling degree days gives the weather the market is implicitly buying. Because a heat rate rises when gas falls, October needs a second column: the same calculation with gas held at its September level, so only the power price moves.
Jul-27 PJM-W 66.62 356 326 314 326 0
Pittsburgh cooling degree days, base 65 °F, calendar-aligned full months. Six-year mean is 2011, 2016, 2019 and 2022–2024; post-super analog is the mean of 2016 and 2024, the summers after previous super-El Niño peaks. Relationship fitted on 66 days of summer 2026 (R2 0.53); it did not change this month, so every move here is the market. August 2011, 2016 and 2019 are scaled from 30-day totals and carry roughly ±5 degree days.
September to October: Jul-27 319 → 356 on the heat rate, 319 → 326 on price alone. The 30-degree-day difference is the gas selloff, not a hotter view of the summer. On price alone the July leg now sits exactly on the post-super analog: the market is paying for a July like 2016 and 2024. August moved 241 → 243 on price, still 57 degree days short of its analog.
The market has not yet moved to the August leg. August is where the remaining value sits, yet in October Aug-27 rose +0.6% against July's +2.1%. The two legs were entered as equals and are no longer symmetric; whether the curve eventually reprices August is the open question for the rest of the winter.
Contract
Fwd heat rate
Implied CDD
Price only
Six-year mean
Post-super analog
Gap, price only
Aug-27 PJM-W
52.18
269
243
248
300
-57
4. Across the markets
Market
Gas hub
Jul-27 heat rate
Δ mo
Summer-27 premium
Δ mo
MISO
ERCOT-N
NEPOOL
within the same market. It separates summer-specific pricing from a general move in the 2027 curve.
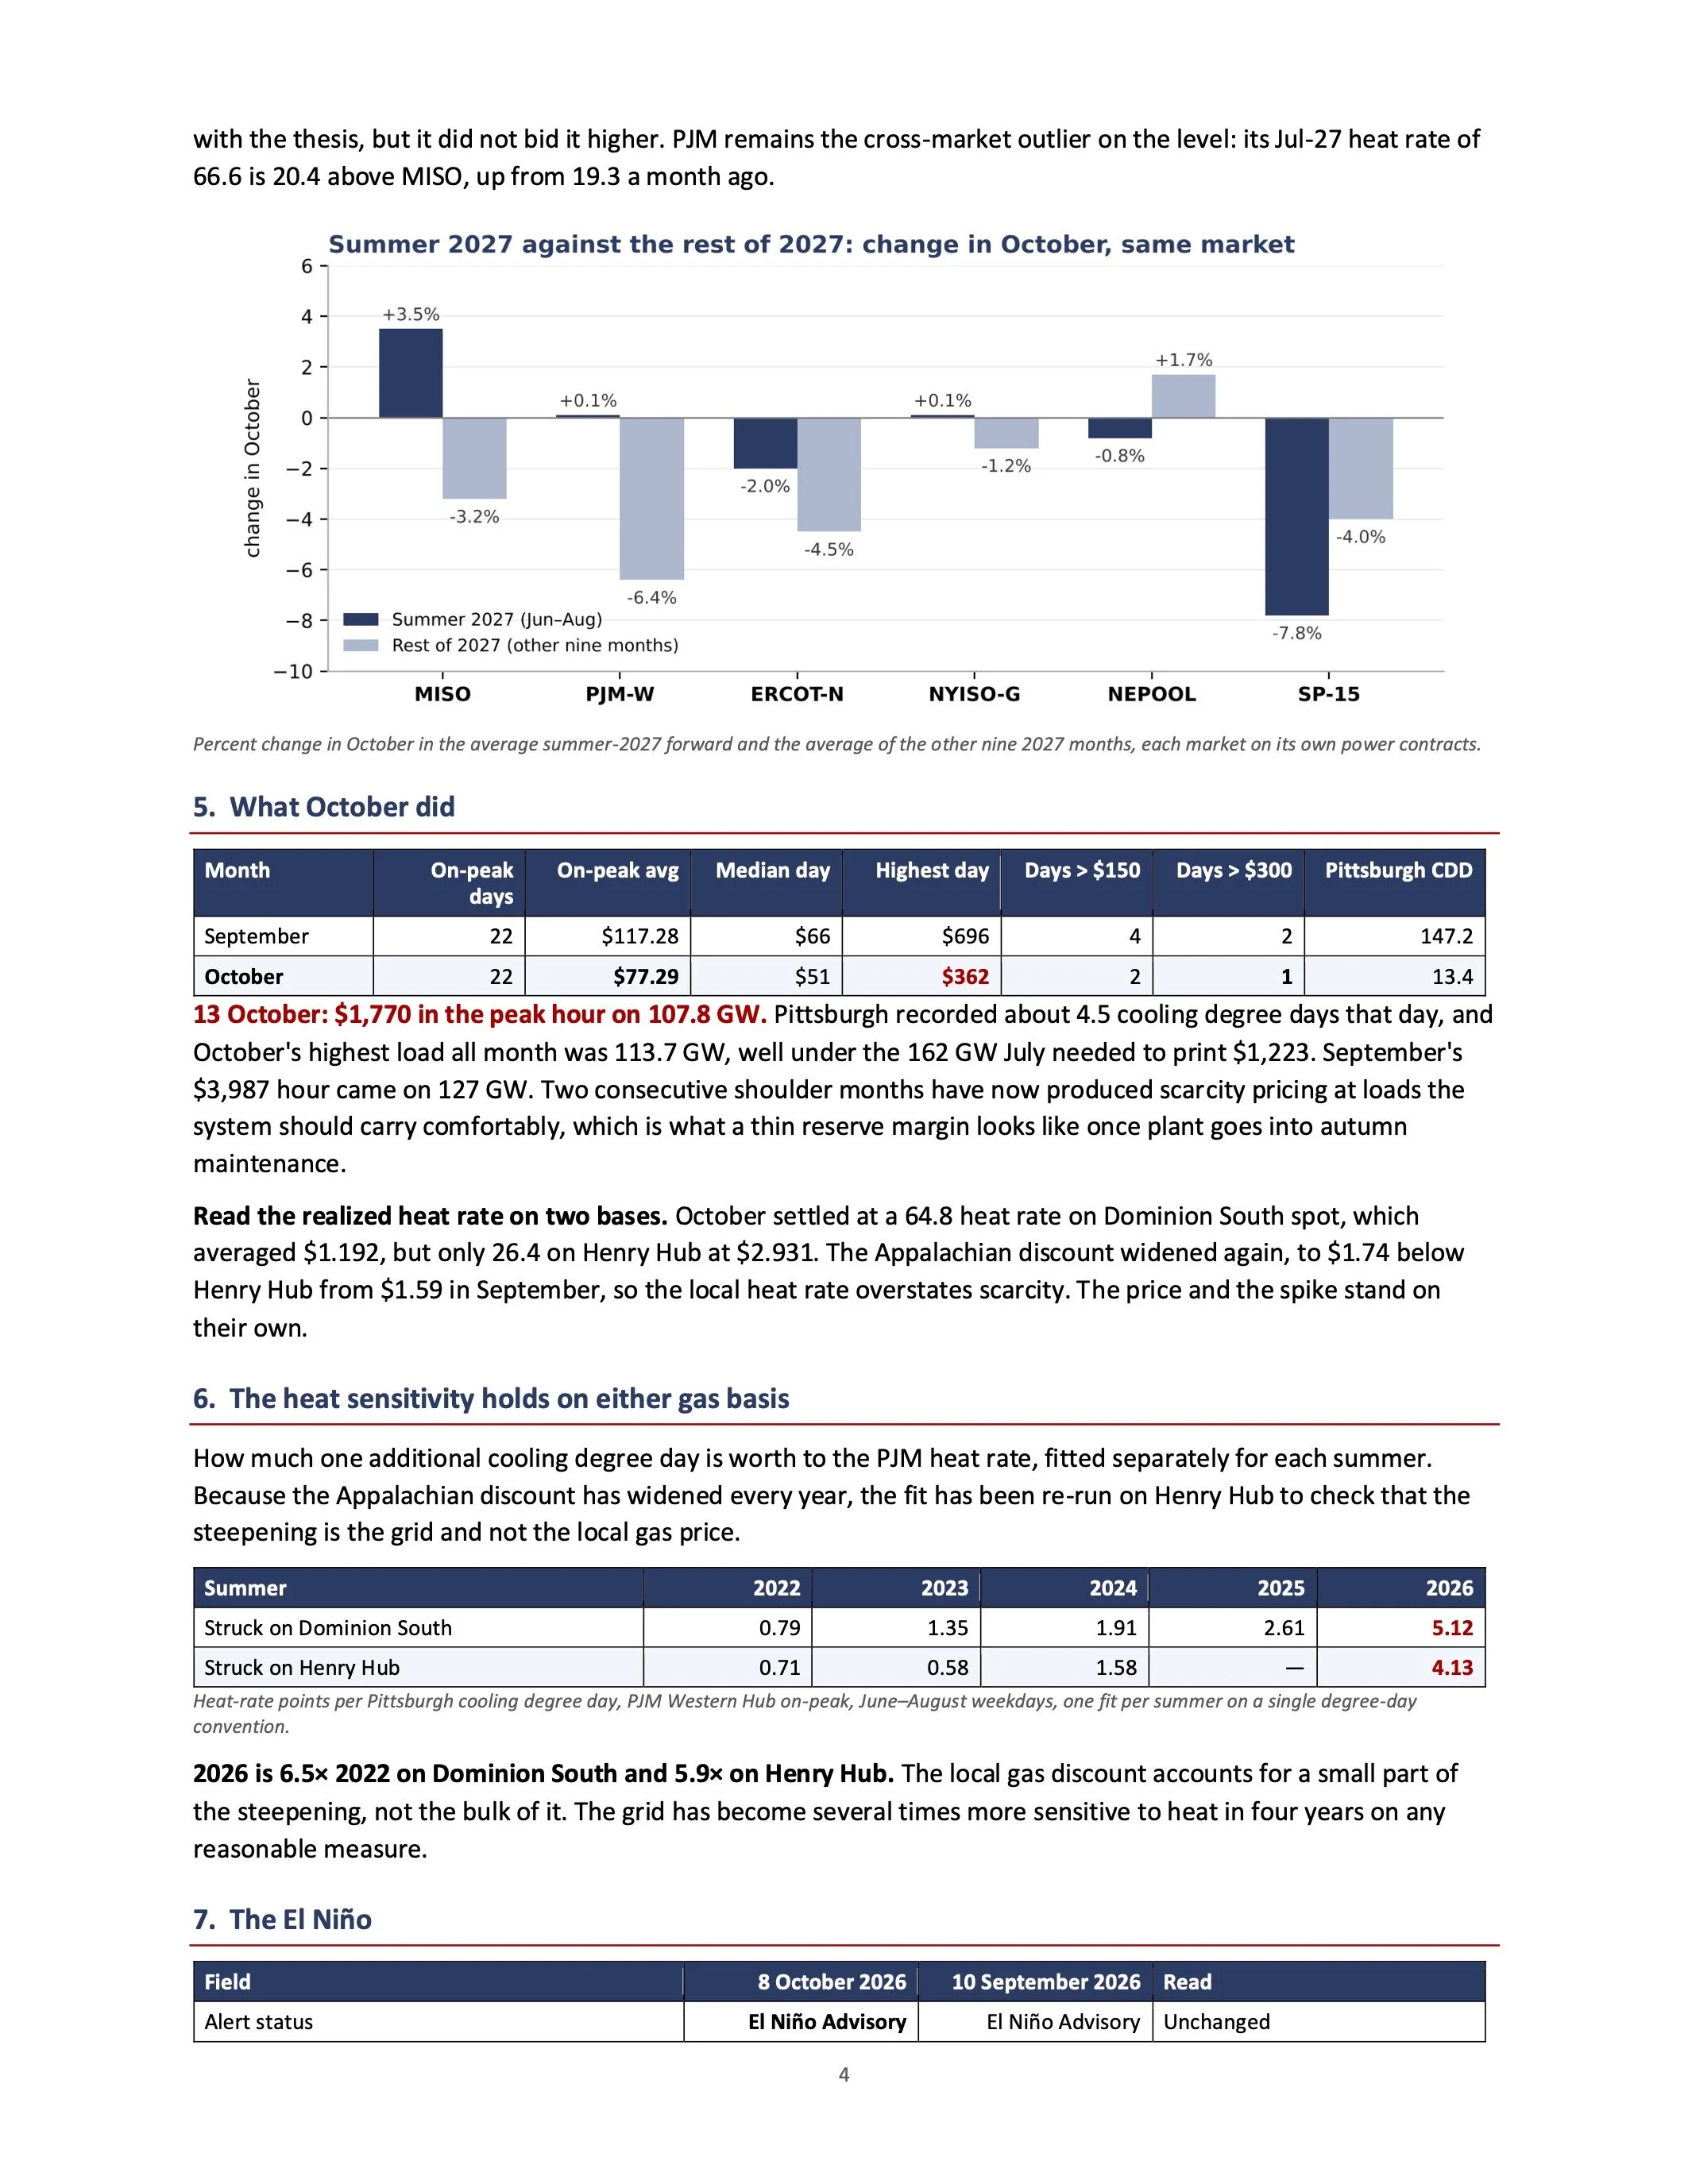
PJM ranked 2 of 6 for a second month and its premium is now 1.424. Two consecutive top-two finishes is the first evidence that cannot easily be put down to coincidence. The qualification is in the chart below. MISO, which led, earned its premium the strong way, with summer contracts up 3.5%. PJM earned it by holding summer flat while the rest of its year fell 6.4%. The market is treating PJM's summer as insulated from cheap gas, which is consistent
Chicago citygate
Henry Hub
46.23 +12.6%
18.79 +5.3%
1.479 1.457 0.846
+0.096 +0.038 -0.021
PJM-W
Dominion South
66.62
+10.3%
1.424
+0.093
NYISO-G
Transco Z6 NY
42.23
+13.7%
0.977
+0.014
28.45 +6.3%
Ranked by the monthly change in the summer-27 premium: the June–August forward divided by the mean of the other nine months of calendar 2027,
Algonquin citygate
SP-15
SoCal citygate
9.86
-3.4%
1.142
-0.047
3
with the thesis, but it did not bid it higher. PJM remains the cross-market outlier on the level: its Jul-27 heat rate of 66.6 is 20.4 above MISO, up from 19.3 a month ago.
Percent change in October in the average summer-2027 forward and the average of the other nine 2027 months, each market on its own power contracts.
5. What October did
September 22 $117.28 $66 $696 4 2 147.2
13 October: $1,770 in the peak hour on 107.8 GW. Pittsburgh recorded about 4.5 cooling degree days that day, and October's highest load all month was 113.7 GW, well under the 162 GW July needed to print $1,223. September's $3,987 hour came on 127 GW. Two consecutive shoulder months have now produced scarcity pricing at loads the system should carry comfortably, which is what a thin reserve margin looks like once plant goes into autumn maintenance.
Read the realized heat rate on two bases. October settled at a 64.8 heat rate on Dominion South spot, which averaged $1.192, but only 26.4 on Henry Hub at $2.931. The Appalachian discount widened again, to $1.74 below Henry Hub from $1.59 in September, so the local heat rate overstates scarcity. The price and the spike stand on their own.
6. The heat sensitivity holds on either gas basis
How much one additional cooling degree day is worth to the PJM heat rate, fitted separately for each summer. Because the Appalachian discount has widened every year, the fit has been re-run on Henry Hub to check that the steepening is the grid and not the local gas price.
Struck on Dominion South 0.79 1.35 1.91 2.61 5.12
Heat-rate points per Pittsburgh cooling degree day, PJM Western Hub on-peak, June–August weekdays, one fit per summer on a single degree-day convention.
2026 is 6.5× 2022 on Dominion South and 5.9× on Henry Hub. The local gas discount accounts for a small part of the steepening, not the bulk of it. The grid has become several times more sensitive to heat in four years on any reasonable measure.
7. The El Niño
Alert status El Niño Advisory El Niño Advisory Unchanged 4
Month
On-peak days
On-peak avg
Median day
Highest day
Days > $150
Days > $300
Pittsburgh CDD
October
22
$77.29
$51
$362
2
1
13.4
Summer
2022
2023
2024
2025
2026
Struck on Henry Hub
0.71
0.58
1.58
—
4.13
Field
8 October 2026
10 September 2026
Read
Field
8 October 2026
10 September 2026
Read
Niño 3.4 anomaly
+2.1 °C
+1.8 °C
Strengthening
Probability of a historic event, ≥ +2.5 °C, Oct–Dec 83% 75% Rising Probability of a very strong event at the peak >90% >90% At the ceiling
NOAA Climate Prediction Center ENSO Diagnostic Discussion, 8 October 2026; the most recent issue at this month end. A historic event would be the strongest since 1950. The odds are tracked on the fixed October–December window; CPC's leading window rolls forward each month and would otherwise show a decline that did not happen. Next issue 12 November 2026.
The anomaly rose another three tenths of a degree and the odds of a record-strength event rose eight points. The more important line is new: CPC now expects a strong-to-very-strong event to persist through January–March 2027, the first statement that reaches into the delivery year. A super El Niño that holds into spring is the precondition for the post-super summer the position is built on.
Strong-to-very strong through Jan–Mar 2027
>83%
not stated
New — reaches into 2027
8. What would make the trade wrong
1
2
3 The forward heat rate contracts two months running on flat gas. 4
5 Solar and storage erode the price tail, as they have in Texas.
Not triggered. Jul-27 heat rate +10.3%.
Not visible in PJM: October produced a $362 day and a $1,770 hour. ERCOT's summer-27 contracts fell 2.0% this month.
Risk
Where it stands
A mild El Niño winter leaves a large April 2027 gas carryout. Cheap gas lifts the heat rate but cuts the dollar price the position settles against.
Moved against the position. April-27 Dominion South fell 15% and Henry Hub 11%; summer-27 Dominion South - 7.5%. Power has not followed yet. This is now the main risk.
PJM revises its summer 2027 peak demand down again.
Not triggered. The forecast is annual; the next revision cannot come before January 2027.
The El Niño forecast weakens, or Niño 3.4 peaks below +1.5 °C.
Further away. Anomaly +2.1 °C, odds of a record event 83%.
Risk 1 deserves the emphasis. The trade's weather case strengthened in October and its gas case weakened. A winter as mild as this El Niño implies would leave storage full in April and pull summer gas lower still. So far PJM summer power has shrugged off a 7.5% fall in its own fuel, but that resistance is the thing to watch through the winter.
5
9. What to watch
The 12 November 2026 CPC discussion, for whether the anomaly holds above +2.1 °C into the winter peak and whether the January–March persistence call firms. December and January weather and storage, which decide how much of the gas selloff is still to come. Whether PJM's summer premium keeps widening because summer rises, rather than because the rest of 2027 falls. And August: the remaining value in the trade sits in that leg, and the curve has not started to price it.
The question in June was whether the curve priced a normal summer. By September it did. By October, on price alone, it priced a post-super July. What is left to be paid is an August like 2016 and 2024, and the threat is no longer the weather but the gas.
Prices as of 30 October 2026. PJM Western Hub on-peak, 5×16 weekdays. PJM Western Hub and SP-15 forwards are marked at the 29 October settlement, the latest available for those two markets, and struck against same-day gas; the other four markets are marked at 30 October. Pittsburgh cooling degree days on the Bloomberg/WSI basis.
6
