
ICEUPWRT ETF
Targeted growth with disciplined risk management
THE PREEMINANCE OF POWER
Power is the most consumed commodity in the U.S. after gasoline, averaging just under $400 billion annually since 2010. Despite its significance, electricity is not included in any easily accessible investment products such as ETFs, mutual funds or commodity indexes, including leading commodity indexes like the Bloomberg Commodity Index (BCOM) or the S&P Goldman Sachs Commodity Index (GSCI)
As demand for electricity consumption grows in the US due to AI, Data Centers, EVs, industrial growth, and the “electrification of everything”, the importance of power in the US will continue to grow.
INVESTMENT STRATEGY
| Category | % Energy CPI | % CPI |
|---|---|---|
| Motor Fuel | 49.3% | 3.17% |
| Electricity | 38.5% | 2.47% |
| Utility Gas Services | 12.2% | 0.78% |
| Energy CPI Subindex | 100% | 6.42% |
TOP 10 HOLDINGS
POWER AS A HEDGE AND DIVERSIFIER
Electricity is the second-largest energy component in the CPI and is becoming even more important as the U.S. moves toward an all-electric vehicle fleet. Electricity is an input cost at most levels of the production cycle and is passed through at every stage of the manufacturing process.
INVESTMENT STRATEGY
Power belongs in an optimized portfolio. A portfolio with power will deliver better overall returns with less risk and better risk adjusted results than a portfolio without power.
| Commodity Index Risk Metrics January 1, 2018 – September 30, 2025 |
|||||||
|---|---|---|---|---|---|---|---|
| Parameters | Power | MLCX | GSCI | BCOM | Crude | Gold | NatGas |
| Annual Returns | 9.54% | 7.99% | -5.52% | 4.91% | 1.92% | 13.82% | -24.01% |
| Annualized Volatility | 24.6% | 21.8% | 22.5% | 14.8% | 43.5% | 15.3% | 54.8% |
| Sharpe Ratios | 0.39 | 0.37 | -0.25 | 0.33 | 0.04 | 0.90 | (0.44) |
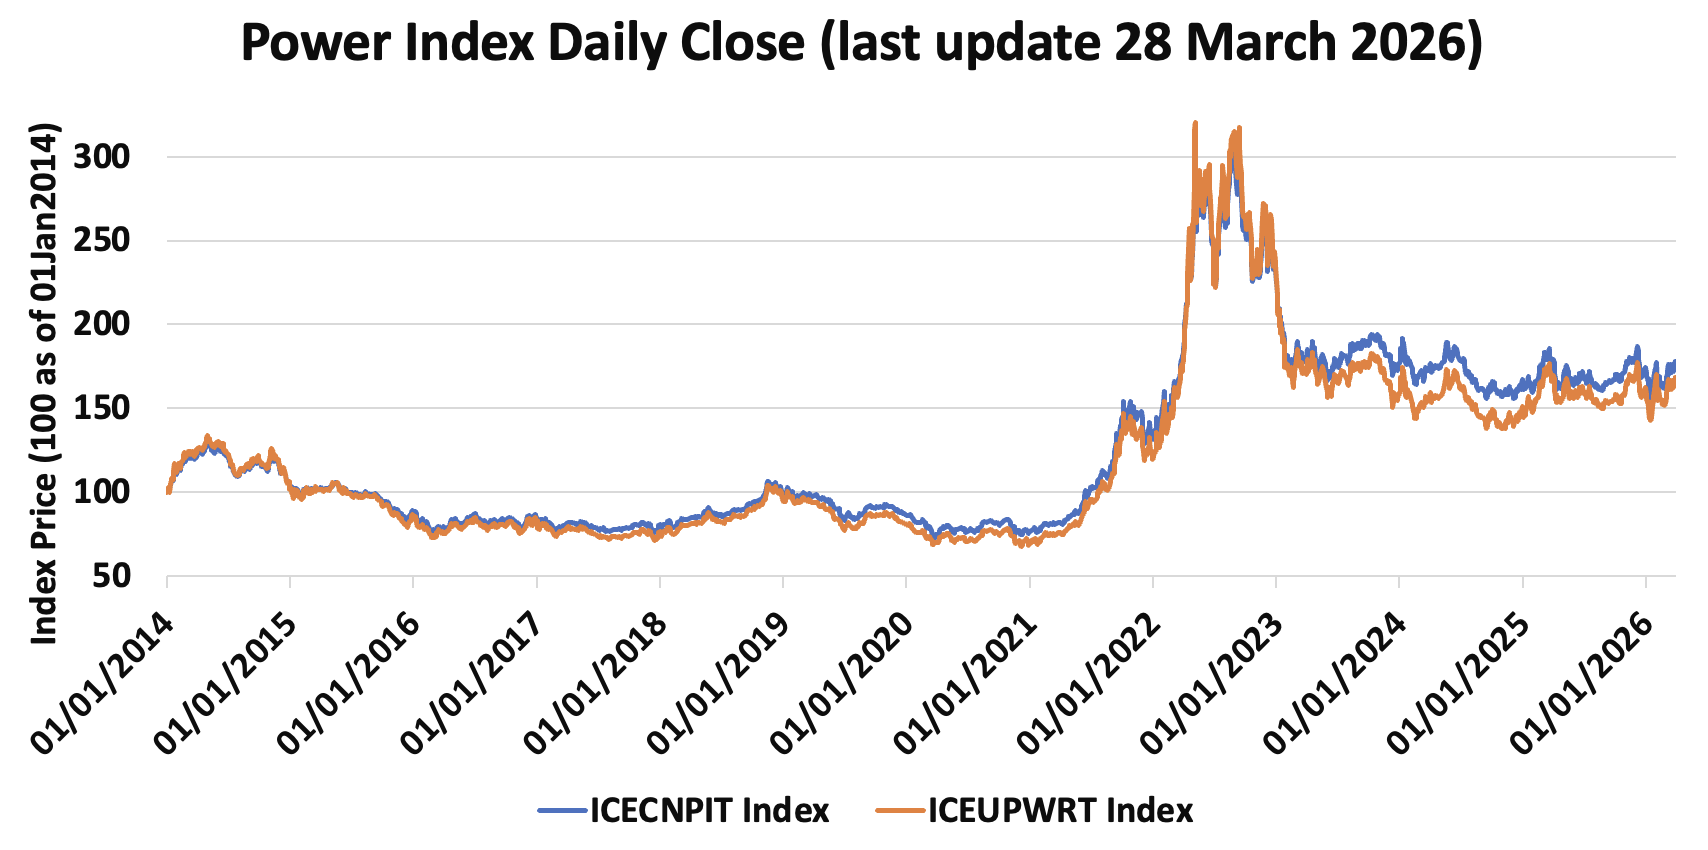
AN INDEX BUILT TO MEET THE NEED
The ICECNPIT provides investors with a rules-based approach to U.S. electricity markets from six major U.S. power hubs:
PJM-W (Pennsylvania, New Jersey, Maryland)
MISO (MidWest)
ERCOT-N (Texas)
CAISO (California)
NY-G (New York)
ISO-NE (New England)
Regional weighting is based on 3-year average annual consumption and adjusted for carbon neutrality with CCAs and RGGIs. This design offsets local volatility while providing stable exposure to the U.S. power market.
